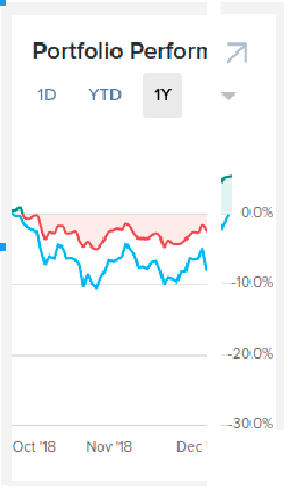
Portfolio Performance (Track record from 8 Sep 2020 where I fully automated algorithmic trading system)
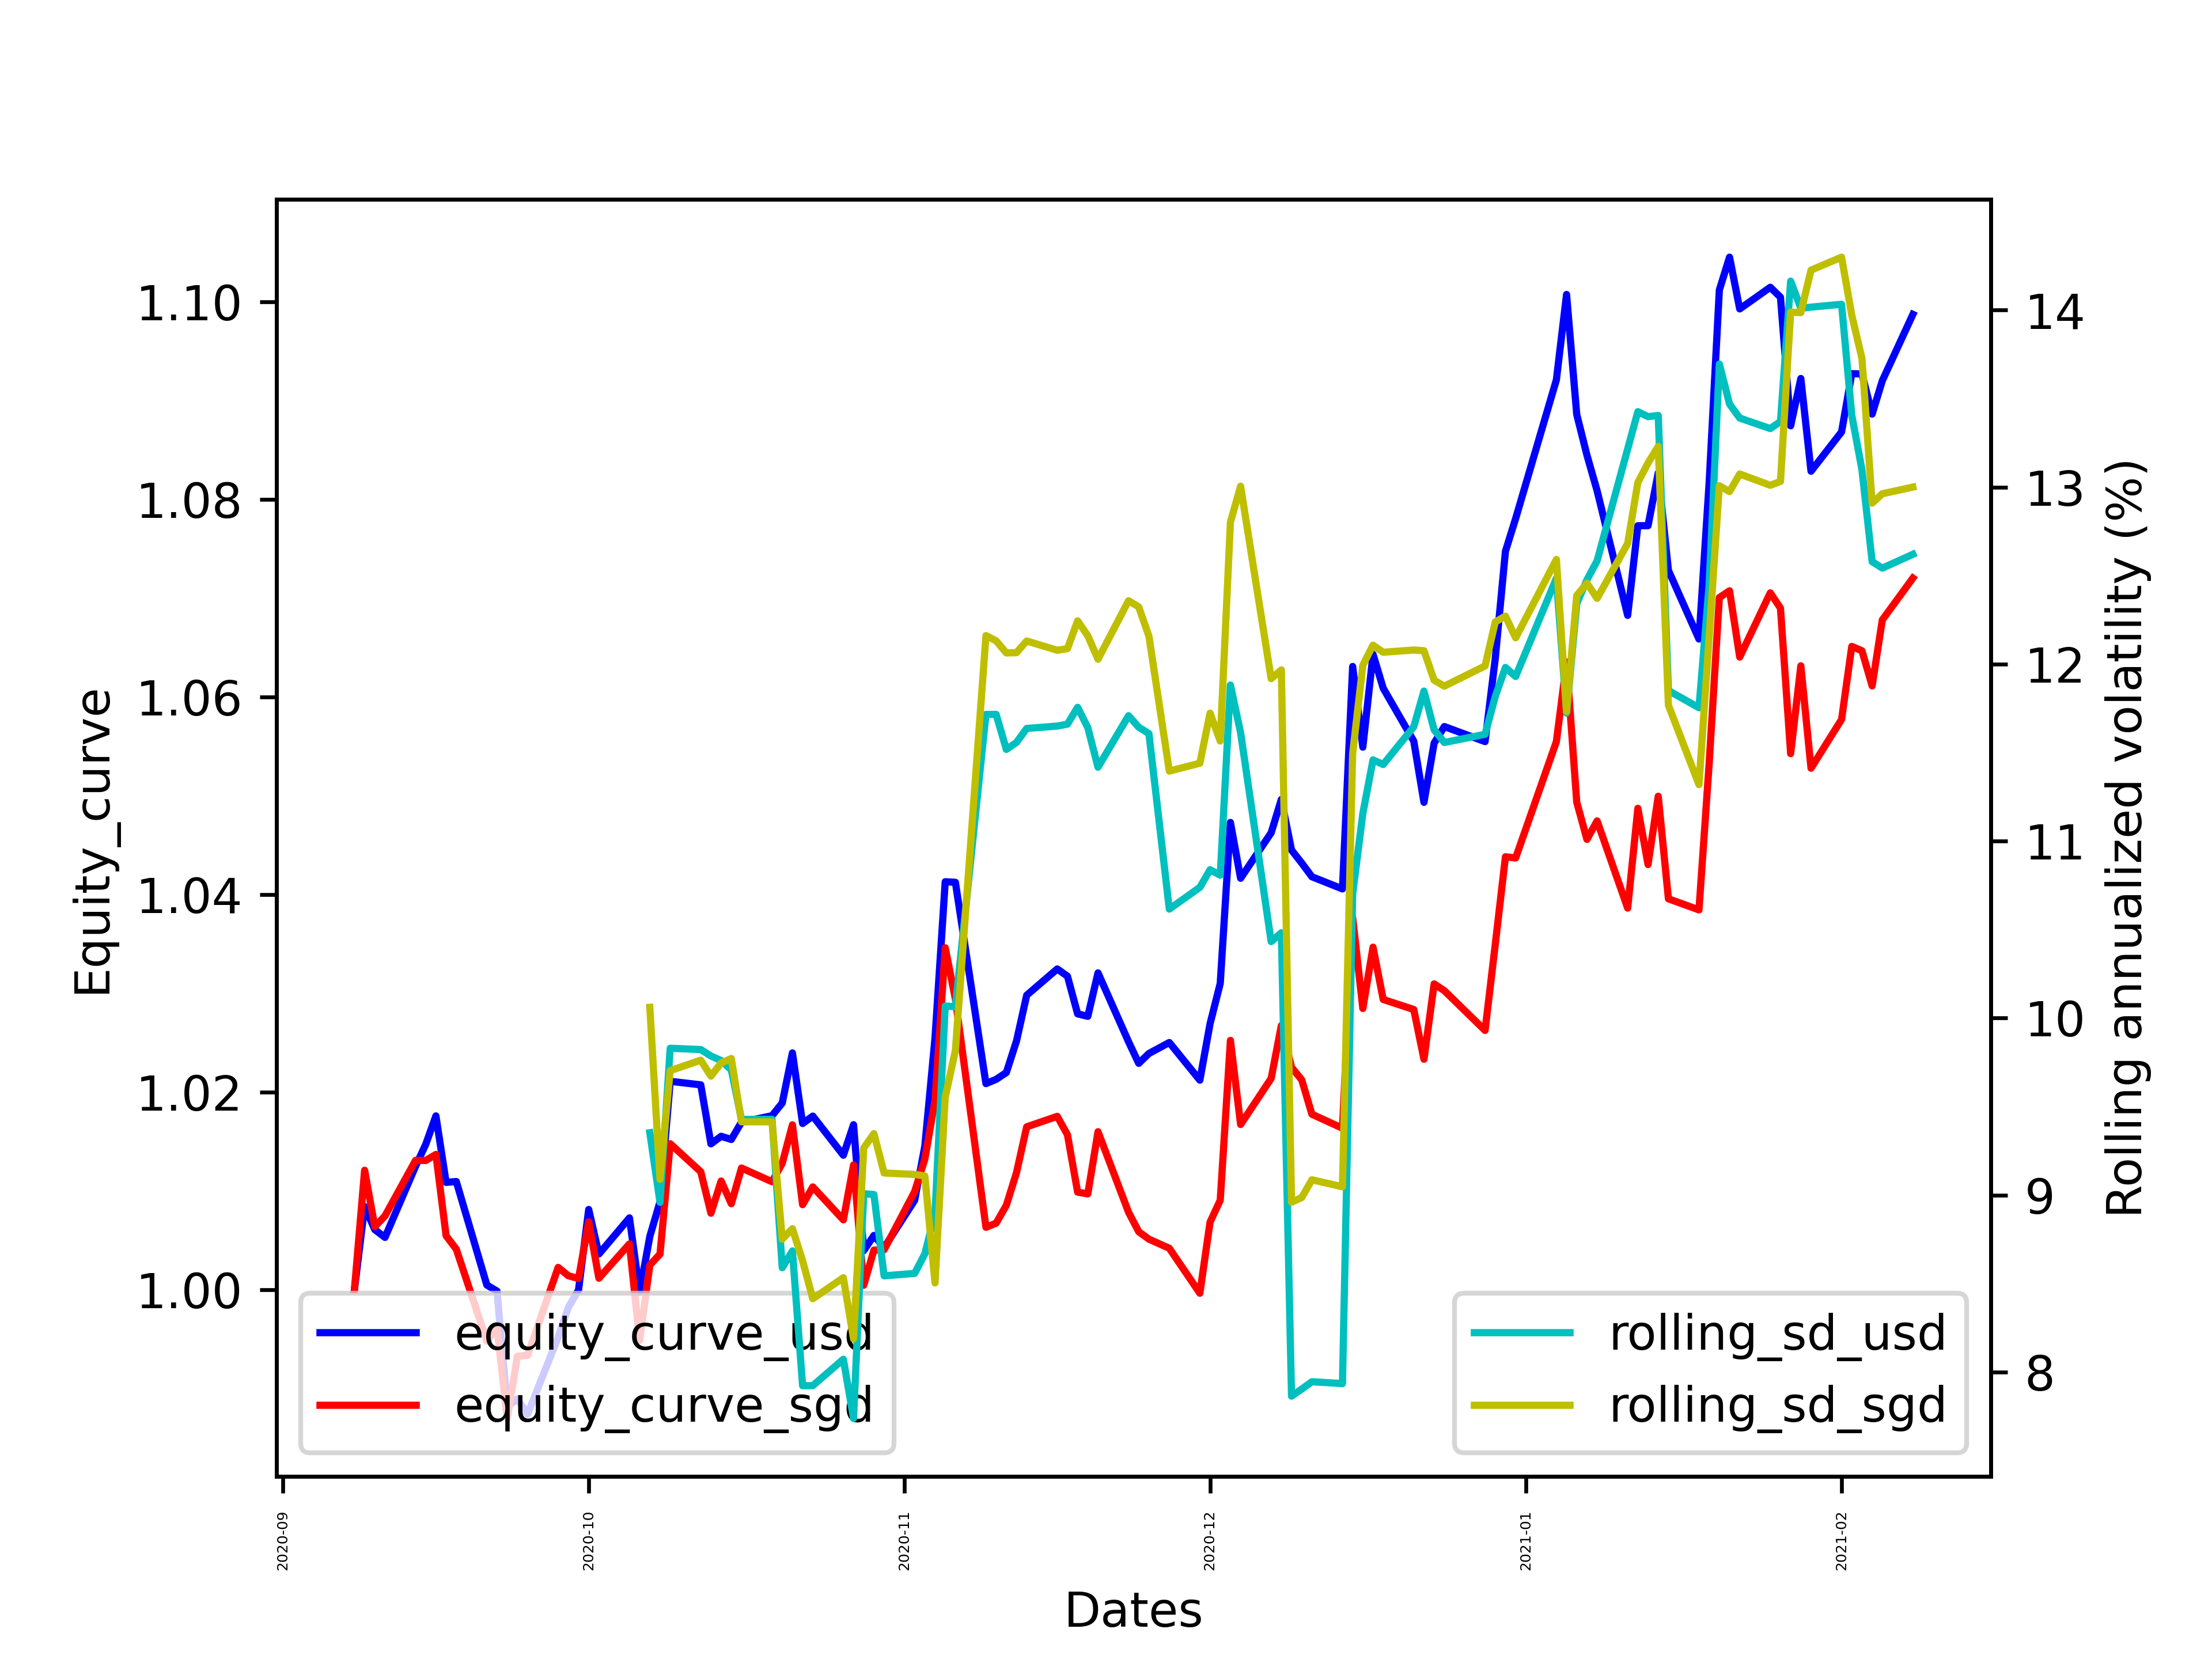
Overall portfolio (excluding options and crypto pnl)
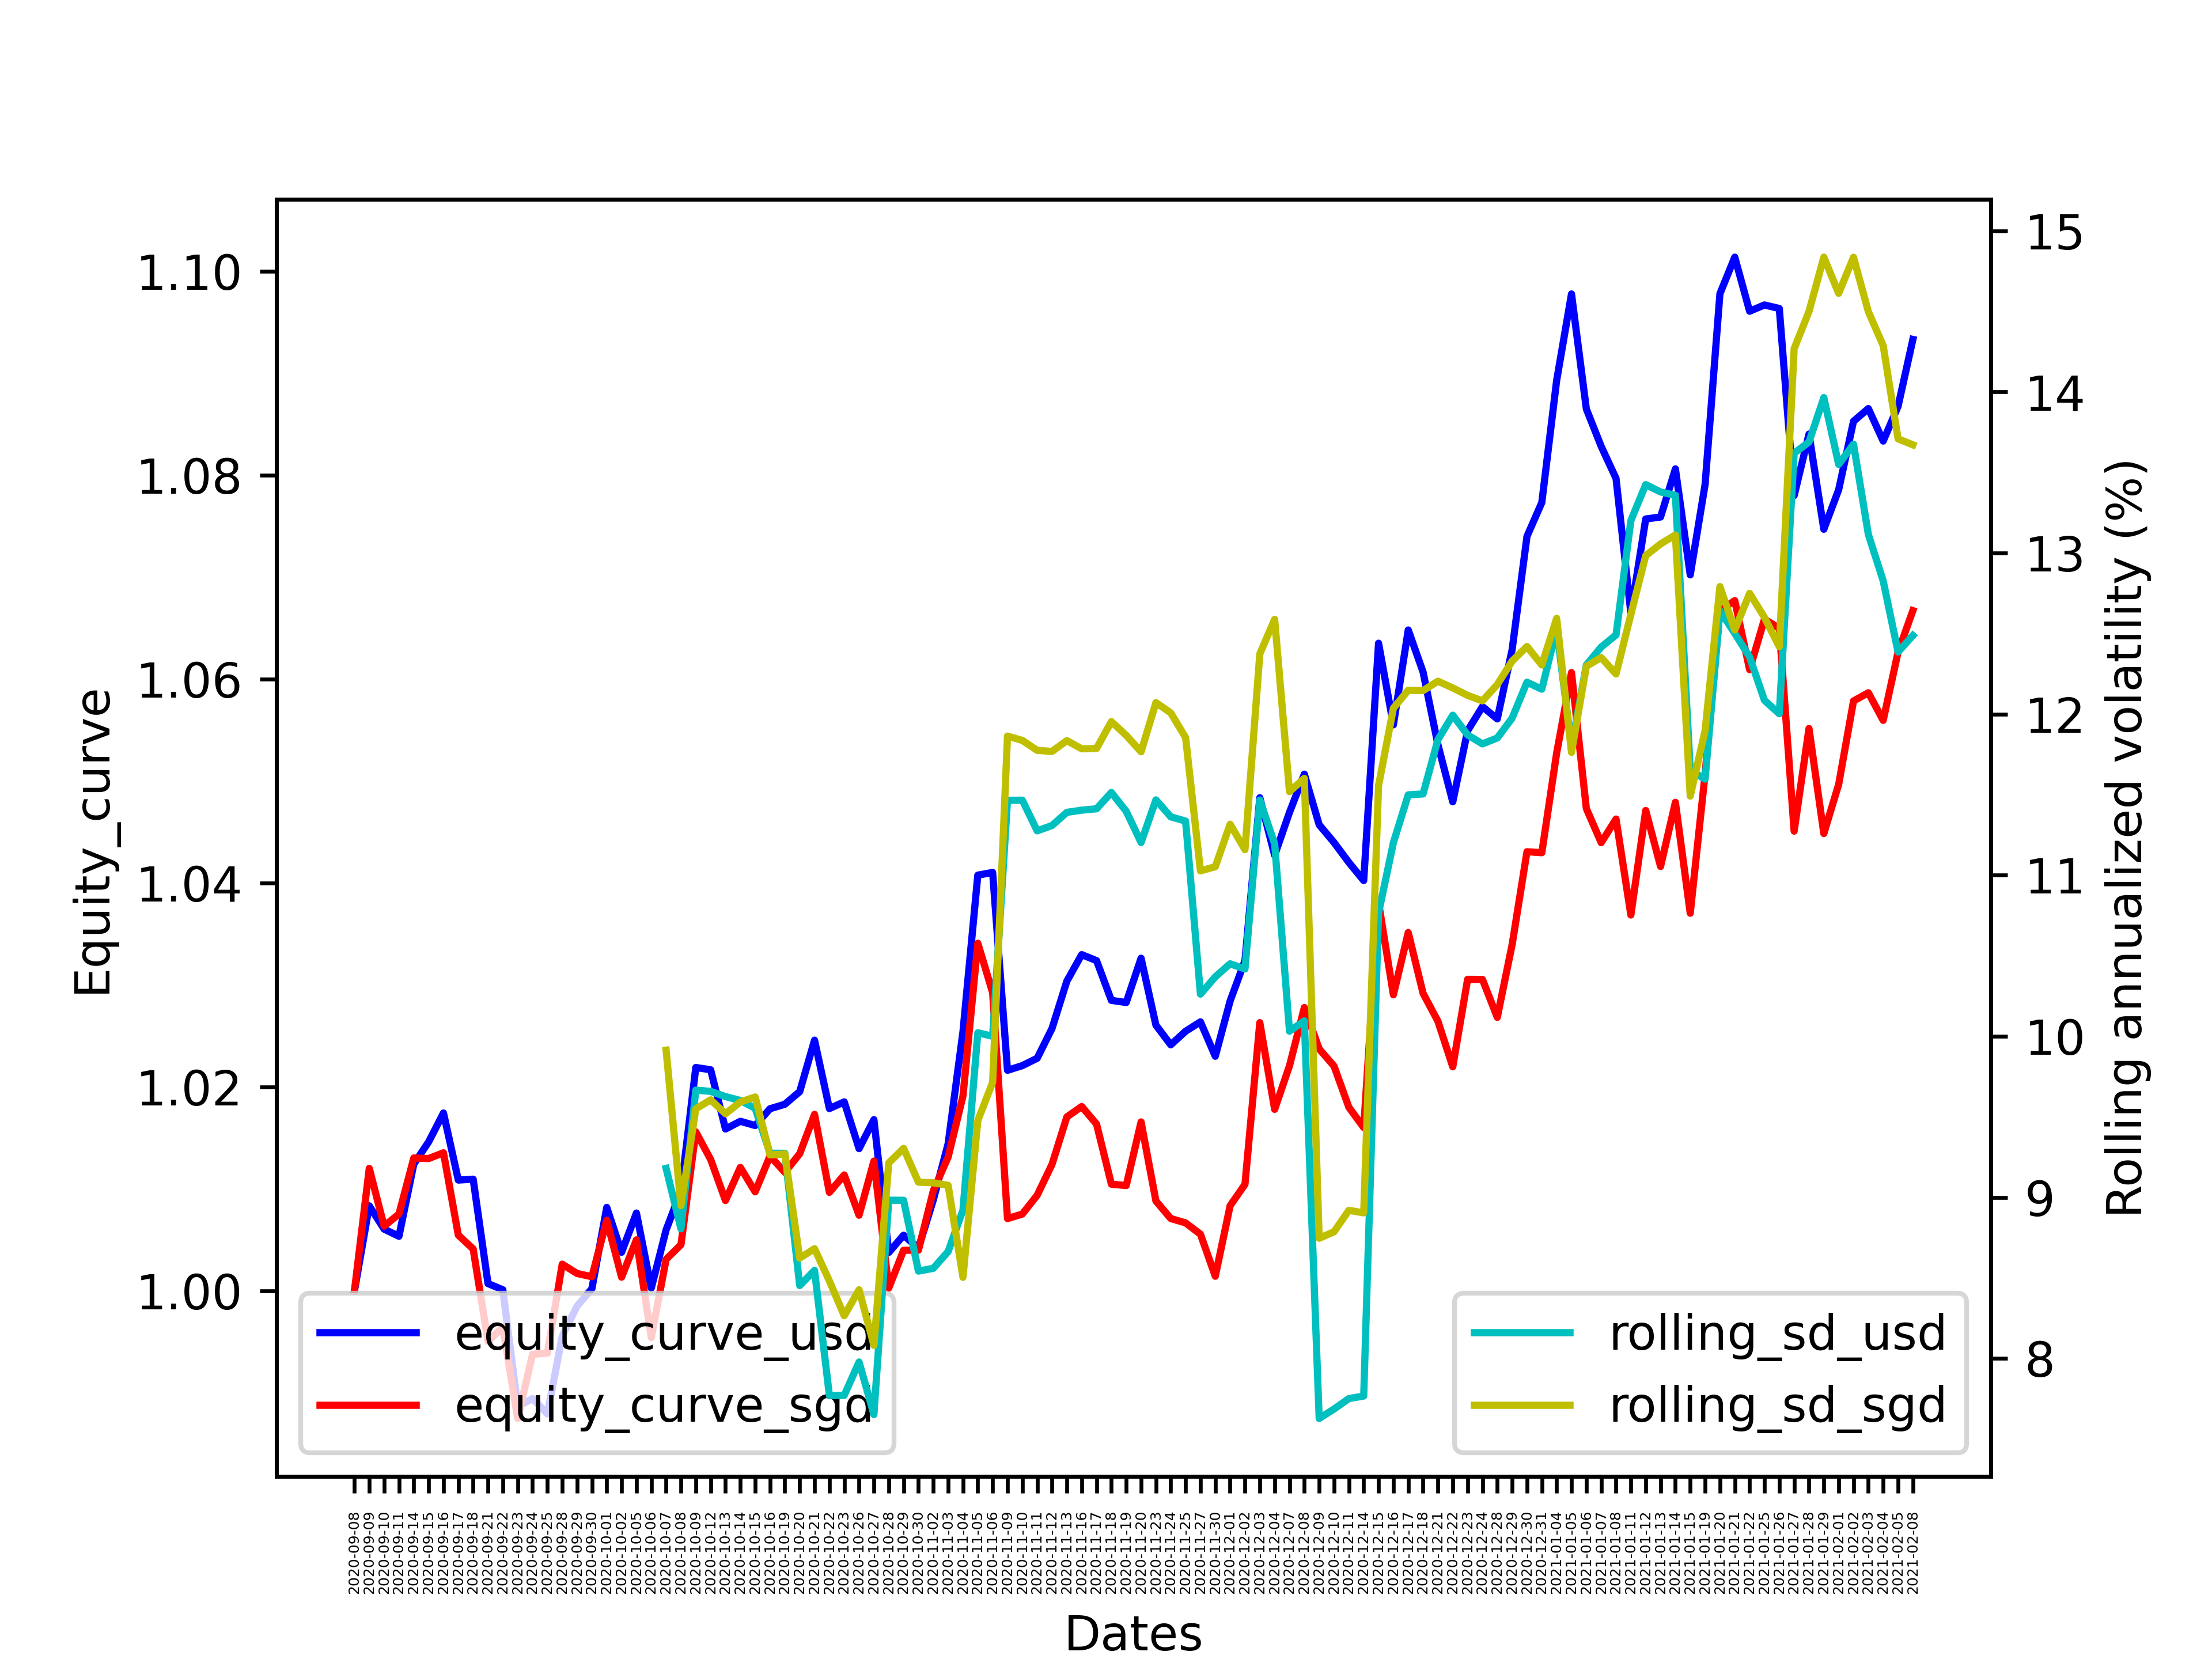
Risk parity portfolio (10% volatility)
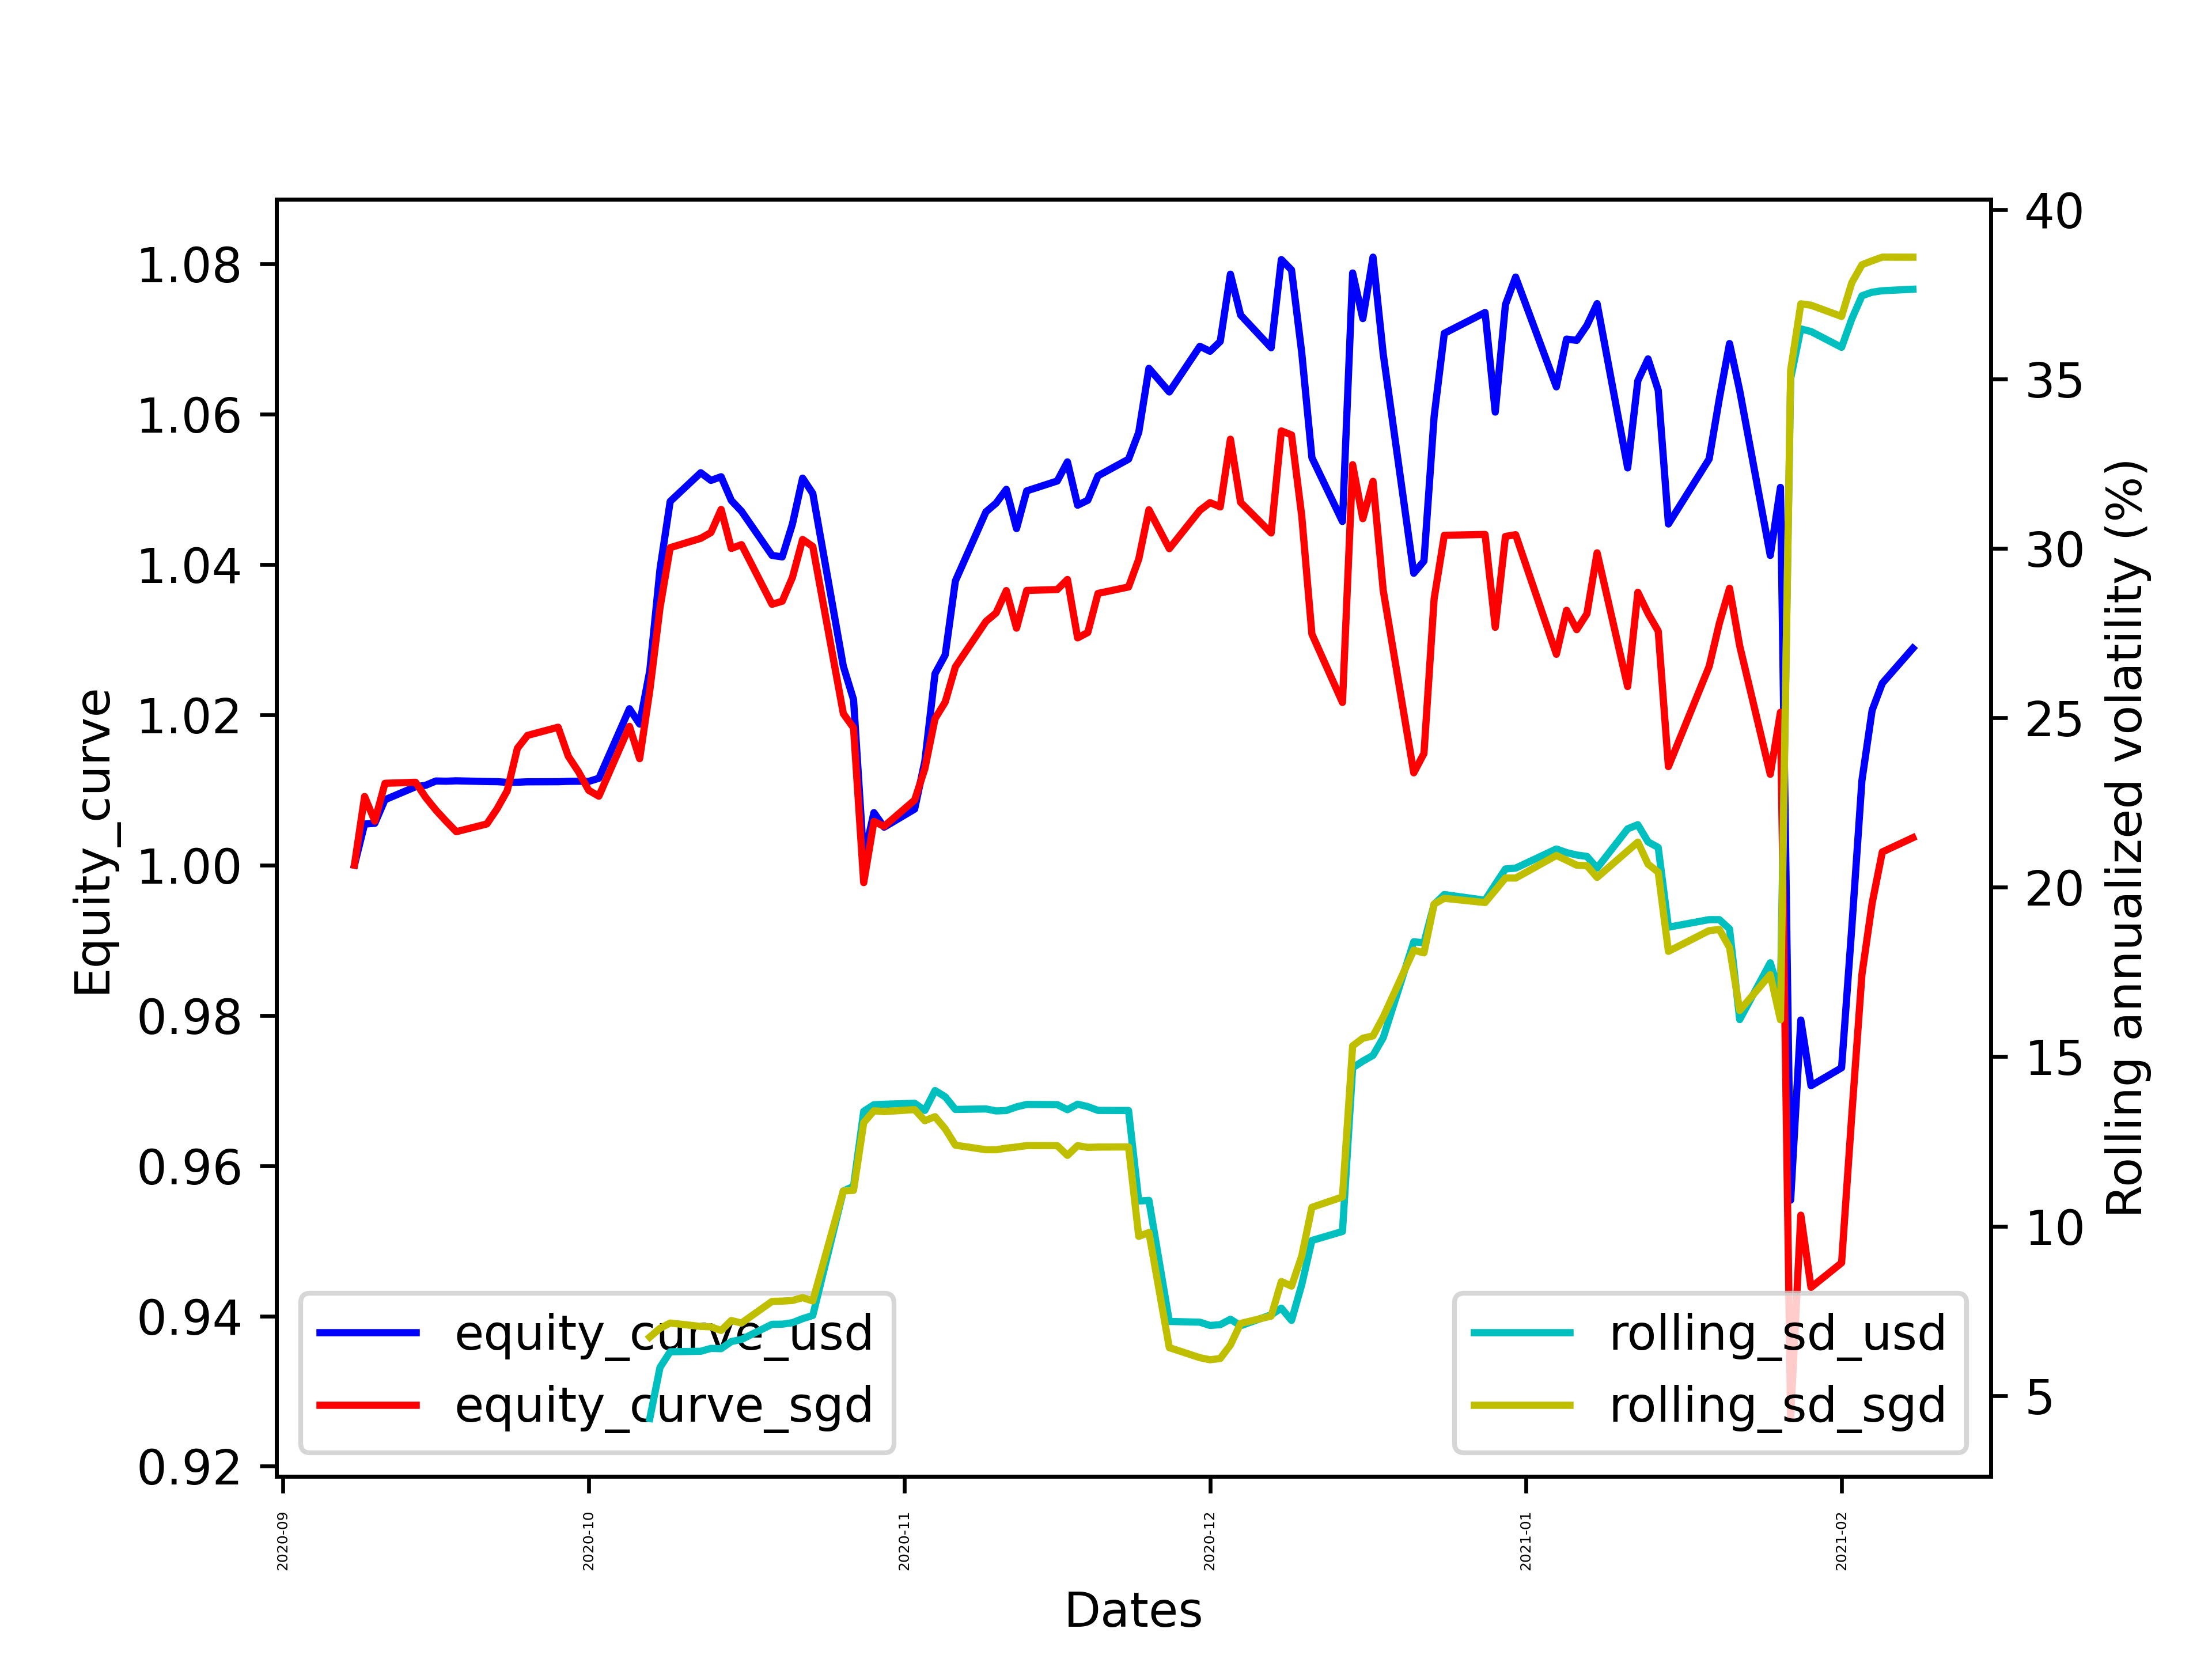
Volatility risk premium portfolio
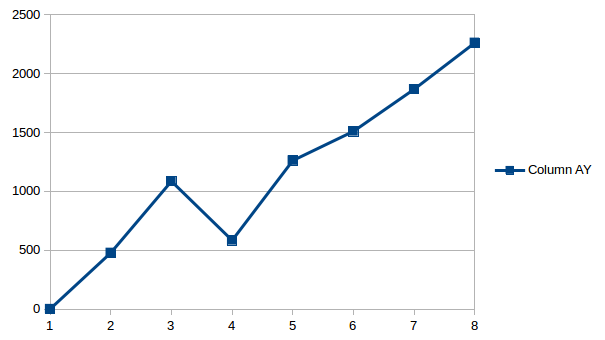
Option strategies (equity curve in dollar)
- Since Dec 2020
- 2261 = +3.8% on 60000 risk capital (8 trades) using margins from risk parity portfolio
- 283 profits per trade.
Crypto strategies (market neutral - yet to create performance monitoring feature)
- Since Feb 2020
- Feb 2020: -118 USD
Hedging profits (yet to create performance monitoring feature)
Algorithmic trading and portfolio management architecture
- As of Sep 2020, I’ve fully automated my trading & portfolio management. See here (https://medium.com/datadriveninvestor/designing-and-building-a-fully-automated-algorithmic-trading-portfolio-management-system-6945c6c87620) for the full architecture.
- Peformance monitoring component of Jarvis is explained here (https://medium.com/datadriveninvestor/developing-a-performance-monitoring-component-in-my-fully-automated-algorithmic-trading-system-88f5afae05cd) & (https://medium.com/datadriveninvestor/developing-a-performance-monitoring-component-in-my-fully-automated-algorithmic-trading-system-983368441bba) & (https://medium.com/datadriveninvestor/performance-monitoring-component-in-my-fully-automated-algorithmic-trading-system-part-3-3d41f14005)
- Forex hedging feature (https://medium.com/datadriveninvestor/deploying-a-hedging-feature-for-foreign-exposure-in-fully-automated-algorithmic-trading-system-8db31f50d3ad)
- As much as possible, I will try to live by this mantra: Anything that can’t be automated doesn’t have a place in my portfolio.
- This radical approach was undertaken to completely remove my cognitive bias/ emotions for better sustainable investment performance.
Investment framework
The objective of the portfolio is to achieve the following against the benchmarks in a year,
- Positive month
- Highest daily win rates in positive periods
- Highest sharpe ratio
- Highest sortino ratio
- Lowest max drawdowns against benchmarks
- Shortest recovery to previous watermark
- Positive alpha against all benchmarks
- Low beta against benchmarks (<= 0.25): Target to maintain beta at around 0.15-0.25 range.
- 10% volatility target or less: The key is to limit the volatility analagous to the odds of flipping a biased coin towards your favour with equal payout. At any day, you wouldn’t know if you will win or lose but you do know you will win 60-70% of the time.
Note: Targeting 100% annual win rate, then quarterly win rate, then weekly win rate, then daily win rate.
Goal of my portfolio is to go against conventional wisdom of higher risk, higher returns through a risk parity approach. It’s entirely possible to engineer higher returns with lower risk (lower standard deviation, downward deviation and drawdowns).
My methodology is based on Quant Finance, Finance, Statistics and Economics. And heavily influenced by Ray Dalio, David Swensen, Robert Carver and Ernest Chan.
Note that I’m not aiming for the highest absolute returns but for the highest risk adjusted returns.
I’ll add a counter to my financial goals for the month if I manage to achieve all the abovementioned criteria for year-to-date.
As it stands, my portfolio is made up of these components,
- Core asset allocation is inspired by Ray Dalio and determined programatically by risk parity algorithms.
- Volatility risk premium tail hedge strategy
- Systematic options trading
Further algorithmic toolkits are developed (some elements may be incorporated but not used completely),
- https://jironghuang.github.io/post/framework-for-capital-allocation/ : Framework for capital allocation
- https://jironghuang.github.io/post/volatility-targeting/ : Volatility targeting
- https://jironghuang.github.io/post/volatility-targeting-could-potentially-increase-risk-adjusted-returns-for-any-quant-strategies/ : Risk parity + Volatility Targeting
- https://jironghuang.github.io/project/what-is-low-regression-approach/ : Regressions of log price with prediction intervals
- https://jironghuang.github.io/project/watch_list/ : ETF watchlist to identify
- https://jironghuang.github.io/project/investment_compass_guidance/ : % from 52 week high vs expected returns 1, 2, 3 years later
- https://jironghuang.github.io/project/hidden_markov_model/ : Regime identification through Hidden Markov Models & Simple Moving Averages to reduce conditional beta on low growth - low inflation enviroments
Note:
- As it stands, 100% of my net worth is devoted to mentioned strategies above. It aligns with my core belief that any analysis should be accompanied with skin in the game. There’s no room for armchair economist talk that is so prevalent in this environment. How you structure your portfolio should reflect your view of the world.
- Goal is to create a smooth and upward sloping equity curve designed to be an ATM to meet my expenses and financial obligations
Future developments
Besides diversifying across asset classes, I’m keen to also diversify across multiple trading strategies,
- Options trading
- Momentum (diversifying across timeframes)
- Factors
- Carry (futures)
- Currency trading - mean reversion, momentum and economics data
- Alternative data
- Cryptocurrency
- Economic data
- Fundamentals data
- HFT order book depth
2021
- Fully automated since Sep-2021
- To do list: Futures-related strategies, Mean-reversion strategies, Momentum strategies in stocks (Andrea Clenow)
Now that I’ve finalised my core portfolio, I will focus on strategies with fix capital sizing and discrete in nature. Profits from these strategies will feed into the core portfolio like a self-reinforcing machine.
Jan 2021
2020
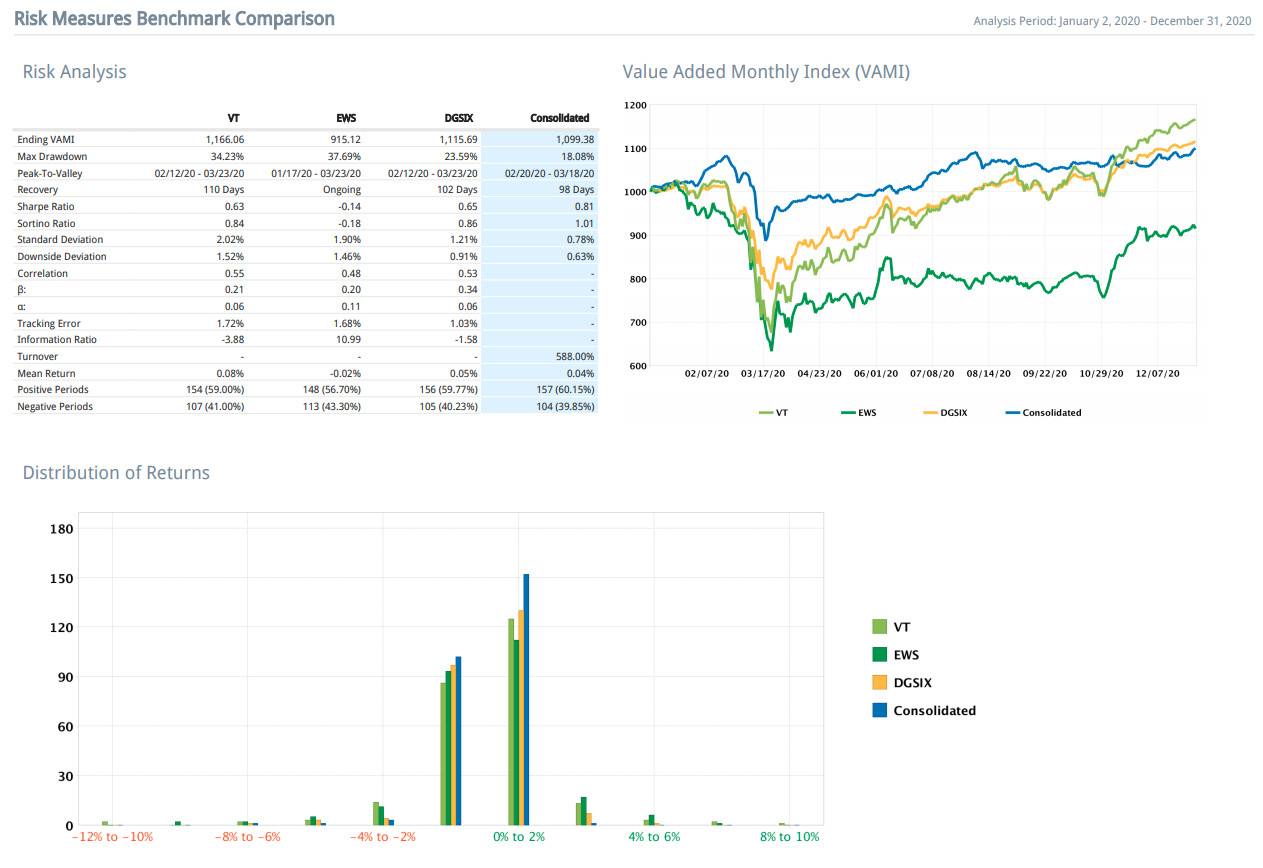
I’ve adopted a risk parity approach + other strategies from 2020 onwards.
+1 indicates achieved goals, % refers to monthly change
- Jan 2020 (+1, monthly change +1.30%) - Rollercoaster ride at the start of 2020. Achieved all targets. Risk parity mix displaying its strength in the face of volatility - with max drawdown of 1.2%; 70% lesser than the benchmarks. So far so good.
- Feb 2020 (+1, monthly change +0.75%) - Positive month (+ 0.75%: YTD from 1.3% to 2.05%) despite the virus. Up 2.05% Year to date. Risk parity really displaying its resilience against the virus. Enhanced with my algorithms to pick up undervalued counters. Achieved all targets.
- Mar 2020 (+1, monthly change -6.3%) - Negative month. -5.9% this month. Employed hedge during the month to reduce volatility. Haven’t integrated formally into Jarvis but will do so to reduce volatility such that volatility is constant across time. That being said, I’ve outperformed the index manifold with 3 times smaller drawdown.
- April 2020 (+1, monthly change +3.3%) - Positive month. Volatility targeting formally built into Jarvis. Rebound is slower than benchmarks but upward trajectory is smoother.
- May 2020 (+1, monthly change +0.34%) - Positive month. Hedges to reach volatility target of 15% completely removed as portfolio volatility dwindles. Far out of the money put options (30% below market price) that costs around 0.1% on a monthly basis is integrated into the portfolio. Changed benchmark of SnP 500 to EWS (Singapore etf) as I think it’s a better benchmark given that’s my home country.
- June 2020 (+1, monthly change +2.07%) - Positive month. Added covered call strategy (potentially additional 6% inversely correlated returns stream to market) Tweaked the system in such a way that if put options are cheap enough to be purchased, use 15% volatility target. Else use 10% volatility target. Removed far out of the money options strategy because it’s too costly to hedge.
- July 2020 (+1, monthly change +6.69%) - Positive record-breaking month. Developed a full risk parity model (equal risk across asset classes) in incubation period. To be deployed after Aug 21. Signals are generated programmatically daily and to be deployed manually. Automated deployment infrastructure is still in the works.
- Aug 2020 (+1, monthly change -0.88%) - Negative month because of Gold and Market Neutral Strategies. Deployed a Minimimum Viable Product for fully automated algorithmic trading infrastructure. Additional features in the backlog. Deploying Volatility Risk Premium model for hedging purposes next. To keep an approximate 5% of portfolio in this strategy. Phased out covered call strategy because it can’t be automated.
- Sep 2020 (+1, monthly change -1.61%) - Negative month due to correction in equties but still approx 5.5% year to date. Drawdown is 3 times lesser than global benchmark. 2nd month of implementing 2 fully automated algorithmic trading strategies. Keen to add a third one using expiring CFDs in Saxo based on Time Series Momentum (TSMOM) and ex-MAN AHL quant Robert Carver Systematic trading framework. Probably based on a continuous forecasting based system rather than a binary take profit - stop loss system. Expected sharpe of 0.5 - seems low but it has positive expected returns with low to inverse correlation with core risk parity portfolio. In addition, commodities other than Gold is missing from my portfolio and an active strategy for this asset class of approx 5-7.5% would be a good fit in jarvis.
- Oct 2020 (+1, monthly change +0.41%) - Positive month. Slight recovery. Good progress this month and glad that the defensive nature of the portfolio is able to counter the onslaught of correction from the equity market. 3rd month of sticking to the fully automated system with no human intervention. May increase leverage cap from 1.8 to 2.0 after president election in order to reduce the negative skew nature of the risk-parity strategy. Still in the midst of developing a trend following strategy in futures market.
- Nov 2020 (+1, monthly change +0.11%) - Positive month. Huge currency drag. Busy with school work; hence did not work much on jarvis.
- Dec 2020 (+1, monthly change +3.89%) - Positive monster month. Incorporated currency hedging feature (which was a huge drag in last few months). And also deployed automated short options strategy that is likely to contribute approximately 3-5% to overall portfolio returns. Archiving trend following in futures at the moment because sharpe is disappointing after 2010. Will relook into the strategy soon. To further improve volatility risk premium strategy and infrastructure of options strategy (use adaptive limit or market orders in patient mode).
Portfolio in blue. Benchmarks in other colours
Interactive Brokers fails to factor in exchange rate effect in their reports; so it’s not an apple to apple comparison. Will create a benchmarking feature in my system in near future.
Nevertheless, I view this as a great year as the portfolio outperformed the benchmarks on risk-adjusted basis.
Portfolio is only fully automated and systemized from 8-Sep-2020.
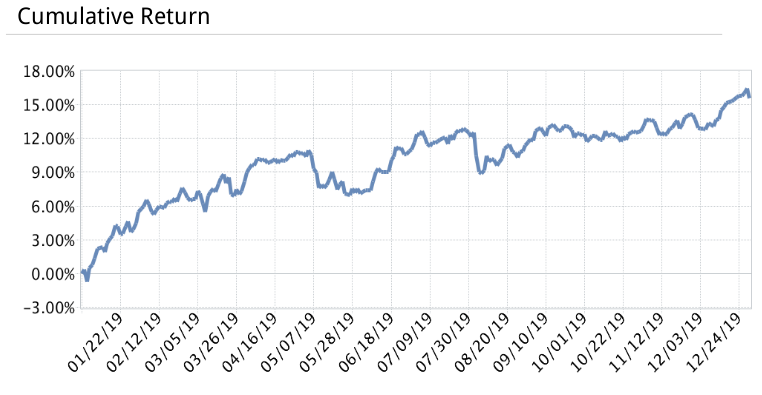
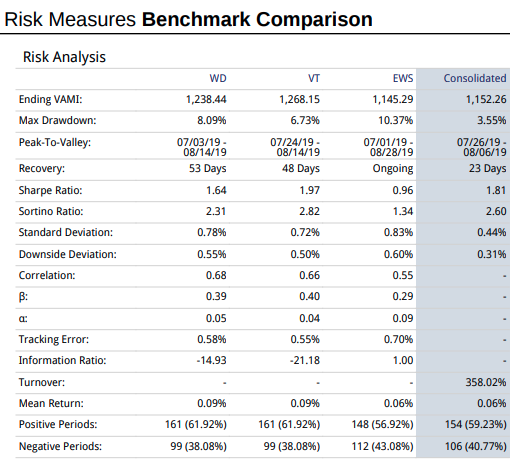
2019 (non risk parity approach here. Adopted a risk parity approach instead since 2020)
Overall, I’m pleased with my Year-To-Date performance. Albeit lower returns, it’s comparable on a risk-adjusted basis with more conservative asset allocation.
If you compare this to Straits Times Index sideway performance over the year, I guess that this is a respectable result?
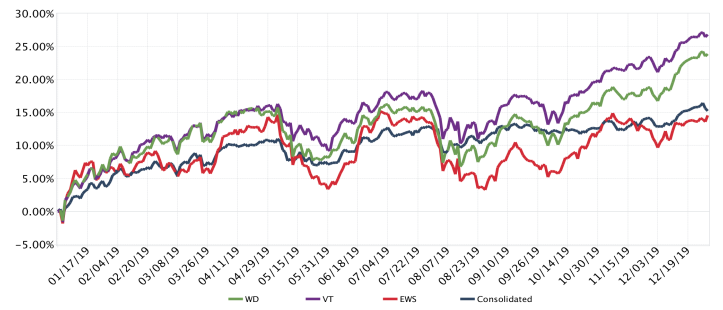
2018 (non risk parity approach here. Adopted a risk approach instead since 2020)
You can notice the strength of my portfolio here. The drawdown is a mere 1⁄3 of the global benchmark.
I do not have the full year performance here as I switched my brokerage midway into the year.