Output updated daily
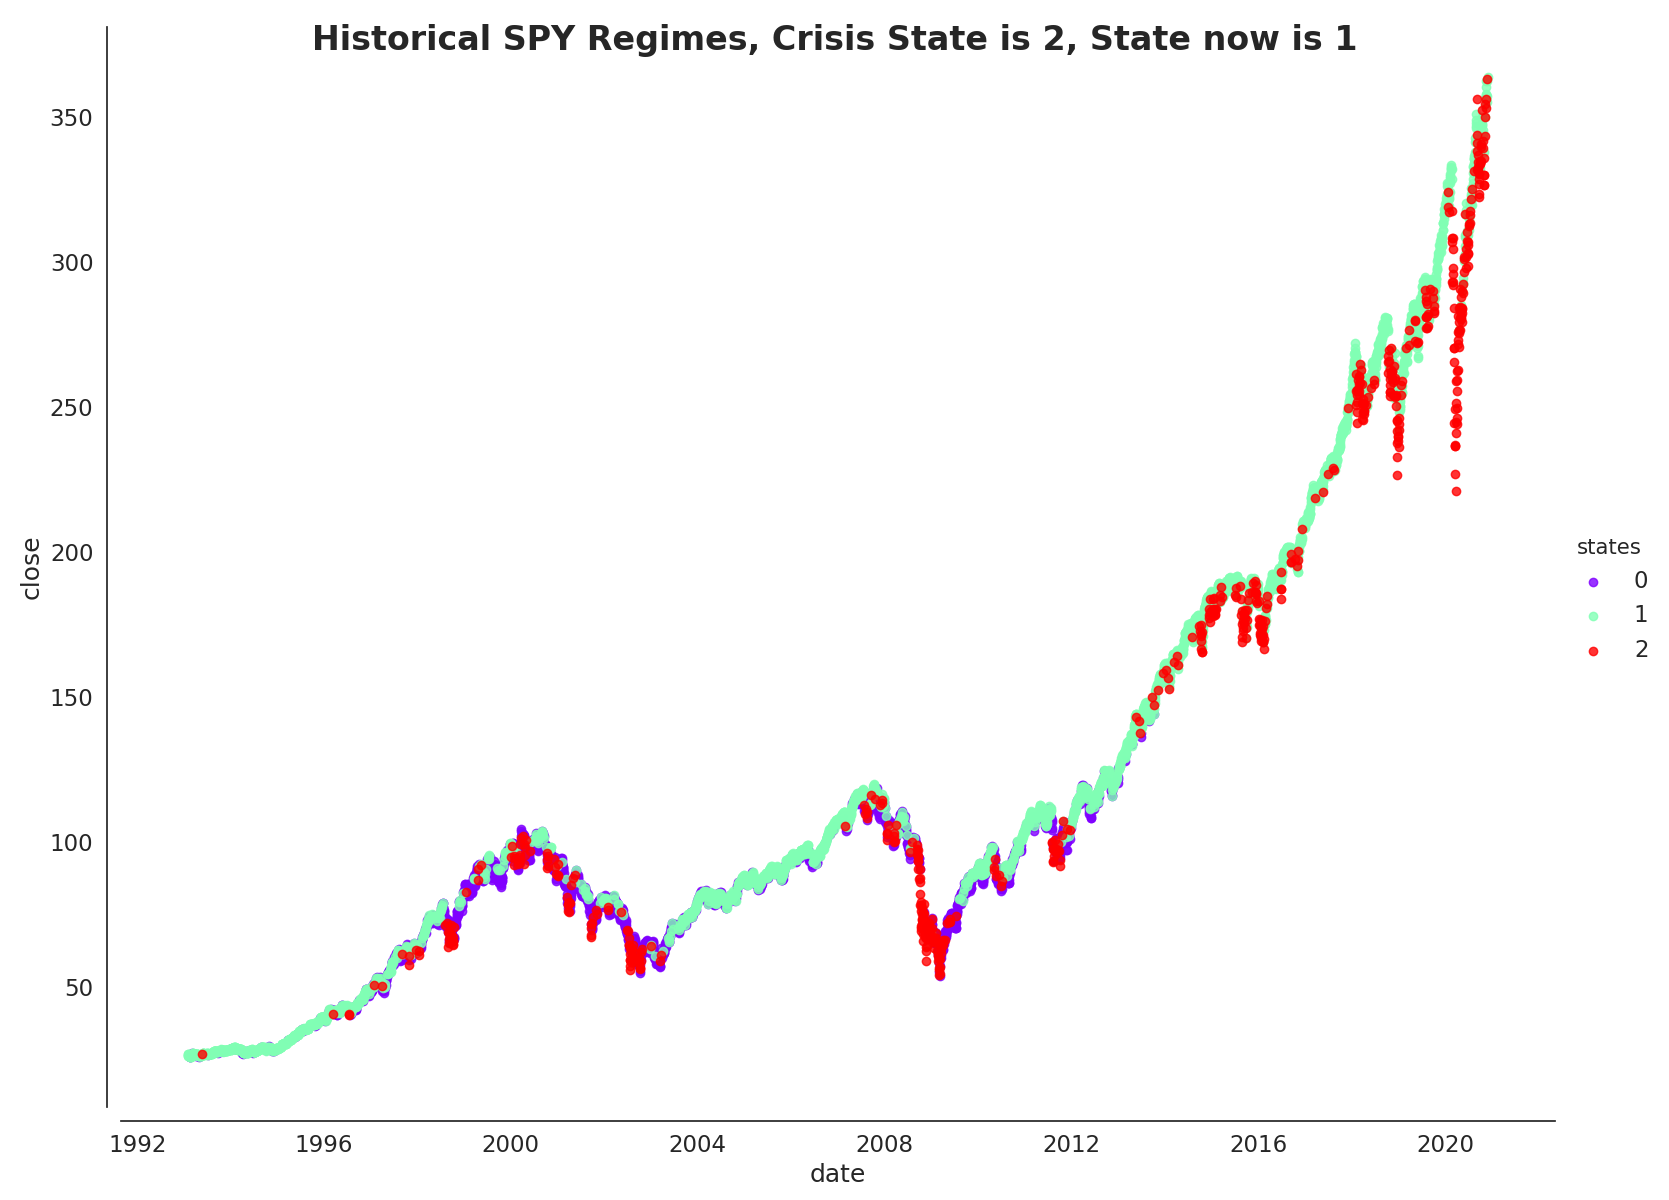
In particular, I’m only highlighting the crisis state (stated in title of graph below) as I seek to hedge against downside risk during crisis/ low-negative growth - low inflation scenarios.
Note: I wouldn’t want to claim credit over the code. I adapted mostly from this post (https://towardsdatascience.com/when-to-buy-the-dip-e2e128d737a7). Changes made are mostly connection to APIs and output files.
Code
#import packages for use later in the HMM code

import pandas as pd
import sklearn.mixture as mix

import numpy as np
import scipy.stats as scs

import datetime as dt

import matplotlib as mpl
from matplotlib import cm
import matplotlib.pyplot as plt
from matplotlib.dates import YearLocator, MonthLocator

import seaborn as sns

from iex import Stock
import yfinance as yf

data = yf.Ticker("SPY")
data.info
all_historic_data = data.history(period="max")

ticker_data_clean = all_historic_data[["Close", "High", "Low"]]
ticker_data_clean["date"] = ticker_data_clean.index
ticker_data_clean["date"] = pd.to_datetime(ticker_data_clean["date"])
ticker_data_clean["range"] = (ticker_data_clean["High"]/ticker_data_clean["Low"])-1
ticker_data_clean["return"] = ticker_data_clean["Close"].pct_change()
ticker_data_clean["close"] = ticker_data_clean["Close"]
del ticker_data_clean["High"]
del ticker_data_clean["Low"]
del ticker_data_clean["Close"]


ticker_data_clean = ticker_data_clean[["date", "return", "range", "close"]]
ticker_data_clean.dropna(how="any", inplace=True)

#create train and test sets
#this methodology will randomly select 80% of our data

#msk = np.random.rand(len(ticker_data_clean)) < 0.8
#train = ticker_data_clean[msk]
#test = ticker_data_clean[~msk]

#X_train = train[["date", "return", "range", "close"]].set_index("date")
#X_test = test[["date", "return", "range", "close"]].set_index("date")

X_train = ticker_data_clean[["date", "return", "range", "close"]].set_index("date")
X_test = ticker_data_clean[["date", "return", "range", "close"]].set_index("date")


model = mix.GaussianMixture(n_components=3,
                            covariance_type="full",
                            n_init=100,
                            random_state=7).fit(X_train)

# Predict the optimal sequence of internal hidden state
hidden_states = model.predict(X_test)

print("Means and vars of each hidden state")
for i in range(model.n_components):
    print("{0}th hidden state".format(i))
    print("mean = ", model.means_[i])
    print("var = ", np.diag(model.covariances_[i]))
    print()


sns.set(font_scale=1.25)
style_kwds = {'xtick.major.size': 3, 'ytick.major.size': 3,
              'font.family':u'courier prime code', 'legend.frameon': True}
sns.set_style('white', style_kwds)

fig, axs = plt.subplots(model.n_components, sharex=True, sharey=True, figsize=(12,9))
colors = cm.rainbow(np.linspace(0, 1, model.n_components))

for i, (ax, color) in enumerate(zip(axs, colors)):
    # Use fancy indexing to plot data in each state.
    mask = hidden_states == i
    ax.plot_date(X_test.index.values[mask],
                 X_test["close"].values[mask],
                 ".-", c=color)
    ax.set_title("{0}th hidden state".format(i), fontsize=16, fontweight='demi')

    # Format the ticks.
    ax.xaxis.set_major_locator(YearLocator())
    ax.xaxis.set_minor_locator(MonthLocator())
    sns.despine(offset=10)

plt.tight_layout()


sns.set(font_scale=1.5)
states = (pd.DataFrame(hidden_states, columns=['states'], index=X_test.index)
          .join(X_test, how='inner')
          .reset_index(drop=False)
          .rename(columns={'index':'Date'}))
states.head()

#Identify state in 2020-03-12-->Crisis state-->Embed in title
row_index = states[states['date'] == '2020-03-12'].index.tolist()
crisis_state = states.iloc[row_index]['states'].tolist()[0]


#suppressing warnings because of some issues with the font package
#in general, would not rec turning off warnings.
import warnings
warnings.filterwarnings("ignore")

sns.set_style('white', style_kwds)
order = [0, 1, 2]
fg = sns.FacetGrid(data=states, hue='states', hue_order=order,
                   palette=colors, aspect=1.31, height=12)
fg.map(plt.scatter, 'date', "close", alpha=0.8).add_legend()
sns.despine(offset=10)
fg.fig.suptitle('Historical SPY Regimes' + ', Crisis State is ' + str(crisis_state), fontsize=24, fontweight='demi')

plt.savefig('')