I simply adapted the code in this post here (https://www.r-bloggers.com/backtesting-a-simple-stock-trading-strategy/) for the following momentum strategy.
This is a momentum based strategy: Long if current day is <50 days of 200 days high. Nil position otherwise.
Returns are pretty impressive for Singapore market. That being said, it will be useful to try it with different parameters and different markets!
#Inspired by the blog post here-->https://www.r-bloggers.com/backtesting-a-simple-stock-trading-strategy/
#http://etfprophet.com/days-since-200-day-highs/
#Simple momentum strategy

rm(list = ls(all = TRUE))

library(quantmod)
## Loading required package: xts## Loading required package: zoo##
## Attaching package: 'zoo'## The following objects are masked from 'package:base':
##
## as.Date, as.Date.numeric## Loading required package: TTR## Version 0.4-0 included new data defaults. See ?getSymbols.library(PerformanceAnalytics)##
## Attaching package: 'PerformanceAnalytics'## The following object is masked from 'package:graphics':
##
## legendticker = "EWS"
stock = getSymbols(ticker,from="1900-01-01",auto.assign=F)## 'getSymbols' currently uses auto.assign=TRUE by default, but will
## use auto.assign=FALSE in 0.5-0. You will still be able to use
## 'loadSymbols' to automatically load data. getOption("getSymbols.env")
## and getOption("getSymbols.auto.assign") will still be checked for
## alternate defaults.
##
## This message is shown once per session and may be disabled by setting
## options("getSymbols.warning4.0"=FALSE). See ?getSymbols for details.##
## WARNING: There have been significant changes to Yahoo Finance data.
## Please see the Warning section of '?getSymbols.yahoo' for details.
##
## This message is shown once per session and may be disabled by setting
## options("getSymbols.yahoo.warning"=FALSE).stock = subset(stock,!is.na(stock[,6]))
daysSinceHigh <- function(x, n){
apply(embed(x, n), 1, which.max)-1
}
myStrat <- function(x, nHold=100, nHigh=200) {
position <- ifelse(daysSinceHigh(x, nHigh)<=nHold,1,0)
c(rep(0,nHigh-1),position)
}
myStock <- Cl(stock)
myPosition <- myStrat(myStock,50,200)
bmkReturns <- dailyReturn(myStock, type = "arithmetic")
myReturns <- bmkReturns*Lag(myPosition,1)
myReturns[1] <- 0
names(bmkReturns) <- 'stock'
names(myReturns) <- 'Me'######################################Performance analysis################################
charts.PerformanceSummary(cbind(bmkReturns,myReturns))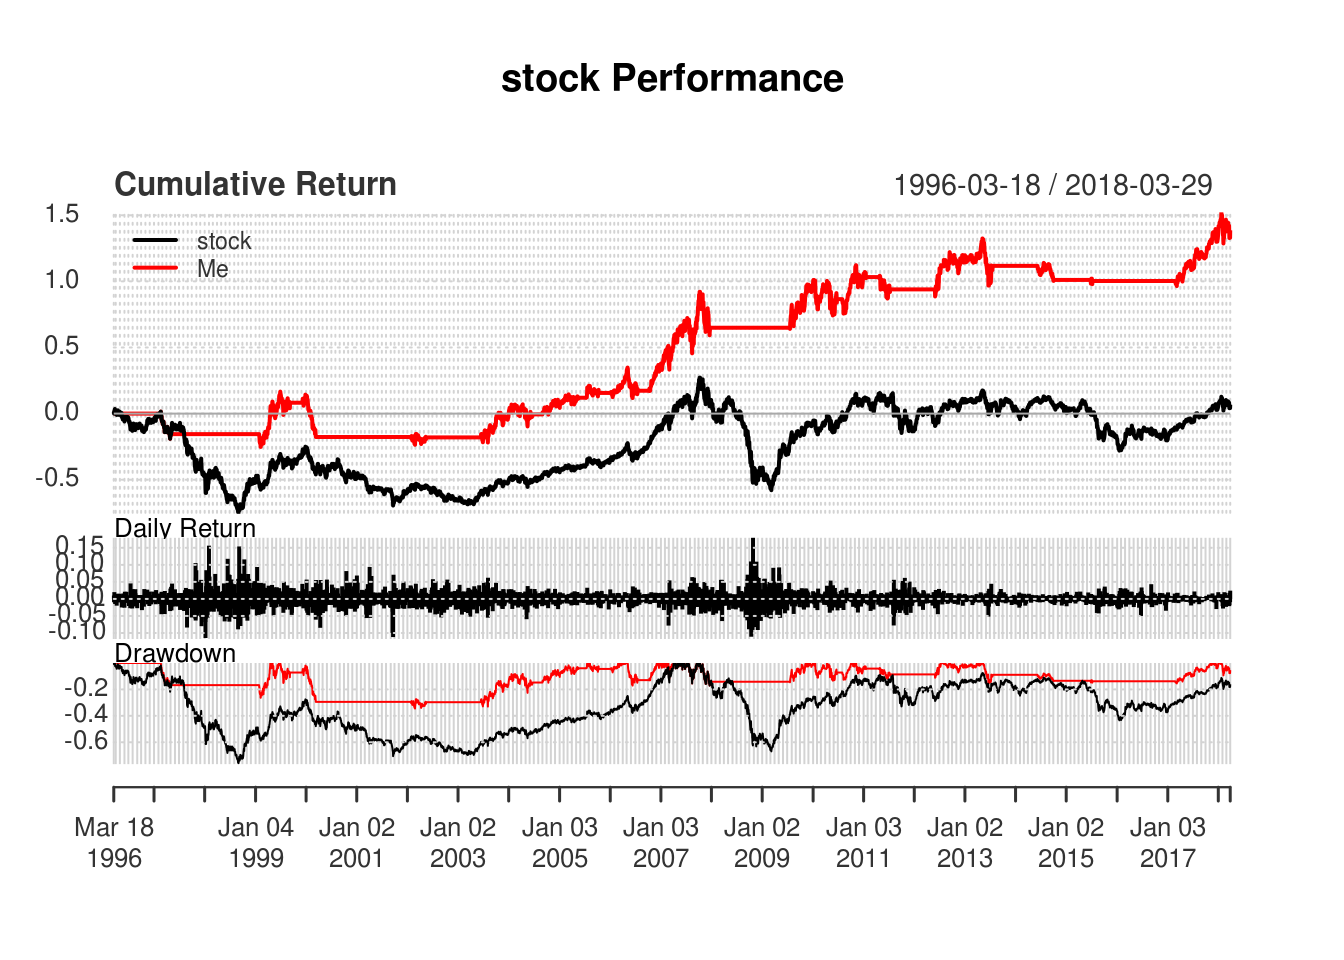
Performance <- function(x) {

  cumRetx = Return.cumulative(x)
  annRetx = Return.annualized(x, scale=252)
  sharpex = SharpeRatio.annualized(x, scale=252)
  winpctx = length(x[x > 0])/length(x[x != 0])
  annSDx = sd.annualized(x, scale=252)

  DDs <- findDrawdowns(x)
  maxDDx = min(DDs$return)
  maxLx = max(DDs$length)

  Perf = c(cumRetx, annRetx, sharpex, winpctx, annSDx, maxDDx, maxLx)
  names(Perf) = c("Cumulative Return", "Annual Return","Annualized Sharpe Ratio",
                  "Win %", "Annualized Volatility", "Maximum Drawdown", "Max Length Drawdown")
  return(Perf)
}

cbind(Me=Performance(myReturns),stock = Performance(bmkReturns))
## Me stock
## Cumulative Return 1.3858788 6.680000e-02
## Annual Return 0.0402951 2.941980e-03
## Annualized Sharpe Ratio 0.2771689 9.957791e-03
## Win % 0.5343203 5.154799e-01
## Annualized Volatility 0.1453810 2.954450e-01
## Maximum Drawdown -0.3448359 -7.584541e-01
## Max Length Drawdown 1522.0000000 2.775000e+03