How I Find Country Pairs for Mean Reversion Strategy
As mentioned in my previous post here, the first step for a mean reversion strategy is to conduct some background quantitative research.
Step 1
First, I use a pair trading function to loop across 800+ country pairs (created from combination function),
pair_trading = function(stock1, stock2, trade_amount, finance_rates, start_date, end_date,
                        prop_train, enter_z_score, exit_z_score){

## More codes here

## Return this
key_info = list(
  ticker = c(stock1, stock2),
  start_date = start_date,
  trade_table = data_trade,
  sharpe = c(sharpeRatioTrainset, sharpeRatioTestset),
  half_life = half_life,
  profits = data_trade_stats,
  max_drawdown = c(table.DownsideRisk(data$pnl[trainset])[1]$pnl[7], table.DownsideRisk(data$pnl[testset])[1]$pnl[7]),
  returns = cbind(table.AnnualizedReturns(data$pnl[trainset]), table.AnnualizedReturns(data$pnl[testset])),
  hedgeRatio_mean_sd = c(as.numeric(hedgeRatio), as.numeric(data_trade$spreadMean[nrow(data_trade)]), as.numeric(data_trade$spreadStd[nrow(data_trade)])),   #critical -->to be used in real-time trading
  close_z_score = as.numeric(data_trade$zscore[nrow(data_trade)]),
  hist_spread = data_trade$spread[(nrow(data_trade) - round(half_life) + 2):nrow(data_trade)],
  prop_days_mkt = c(prop_days_mkt_train, prop_days_mkt_test),
  close_price = c(data_trade$Close[nrow(data_trade)], data_trade$Close.1[nrow(data_trade)]),
  win_rate = c(perc_win_train, perc_win_test)
  # ,
  # chart_train = charts.PerformanceSummary(data$pnl[trainset]),
  # chart_test = charts.PerformanceSummary(data$pnl[testset])
)

return(key_info)

}
Step 2
- Next, I select pairs with sharpe ratio >1 in both training and testing periods.
- And also select pairs with shorter half-life i.e. shorter duration before it reverts to its mean path - more than 5 and lesser than 25
Step 3
Then I went on to IShares website to get the respective tickers’ industries’ composition.
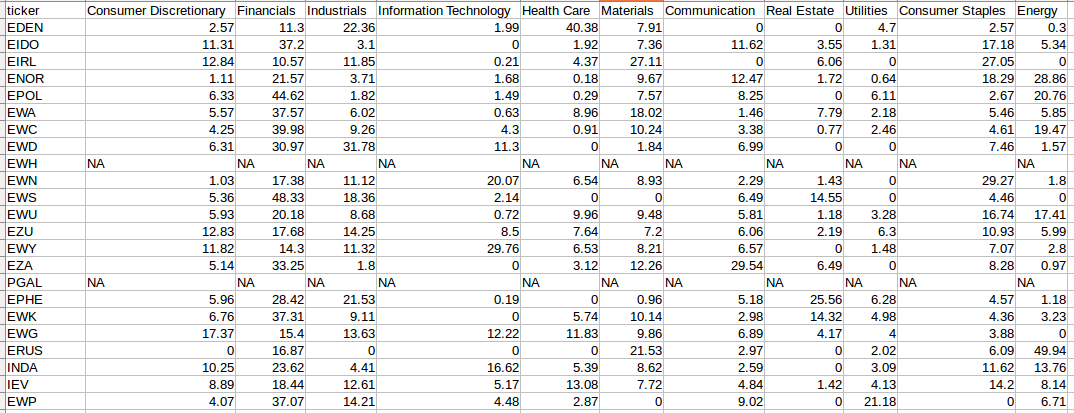
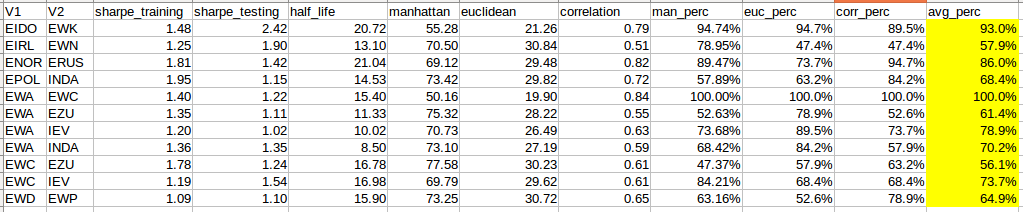
With this new piece of information, I went on to compute the manhattan distance, euclidean distance and correlation between these country pairs.
Next I applied percentile ranks to these distance measures and find an average percentile rank
Anything that is above 50th percentile is selected.
distance_metrics = function(stock1, stock2){

  dist = c(NA, NA, NA)

  tryCatch({

  ctry_pair_composition_sub = subset(ctry_pair_composition, ctry_pair_composition$ticker == stock1 | ctry_pair_composition$ticker == stock2)
  manhattan = as.numeric(distance(ctry_pair_composition_sub[, -1], method = "manhattan"))
  euclidean = as.numeric(distance(ctry_pair_composition_sub[, -1], method = "euclidean"))
  correlation = cor(as.numeric(ctry_pair_composition_sub[1, -1]), as.numeric(ctry_pair_composition_sub[2, -1]))

  dist = c(manhattan, euclidean, correlation)
  }, error=function(e){})

  return(dist)
}
And ta-dah! This is the final selected country pairs that I will be using for my mean reversion strategy.
Further improvement
Note: I could have applied co-integration test. Will do it pretty soon.