DAX index and Germany ETF
I will keep it short in this post since I espoused on this strategy a couple of times.
I discovered another market neutral opportunity this month.
And this is based on ratio between Germany DAX index and MSCI based Germany ETF (EWG)
Based on backtest, sharpe ratio is close to 1.16.
The composition between these 2 indexes are largely similar and any significant deviation shouldn’t persist for long.
The optimal lookback period for the MA component in bollinger band is approximately 30 days.
As this is backed by stellar performance and economic reason, I’ve decided to deploy some capital to this strategy.
Disclosure
- I executed a short (DAX 30) CFD long (EWG) strategy on 23-September with approximately $35880 on both positions.
- I entered at a ratio of 12345/26.97 = 457.7308 with expected profits of 1.04%.
- Max holding period is 16 work days (ending on 15th October 2019) based on half life formula here (http://en.wikipedia.org/wiki/Ornstein-Uhlenbeck_process) as advised by Ernest Chan. See his example for further explanation
- I’m using pushoverr notification api linked to my phone app within my cron task scheduler. It will inform me to close my positions when the ratio dips below moving average.
suppressMessages(sapply(c("zoo", "tidyr", "plyr", "dplyr",
         "gtools","googlesheets", "quantmod",
         "urca", "PerformanceAnalytics", "parallel", "TTR", "pushoverr"), require, character.only = T))
## zoo tidyr plyr
## TRUE TRUE TRUE
## dplyr gtools googlesheets
## TRUE TRUE TRUE
## quantmod urca PerformanceAnalytics
## TRUE TRUE TRUE
## parallel TTR pushoverr
## TRUE TRUE TRUEsource('util/calculateReturns.R')
source('util/calculateMaxDD.R')
source('util/backshift.R')
source('util/extract_stock_prices.R')
source('util/cointegration_pair.R')
stock1 = "^GDAXI"
stock2 = "EWG"
n_days = 30
prop_train = 0.7
start_date = "2000-07-01"
end_date = "2019-12-30"
#Start of function
data1 = df_crawl_time_series(stock1, start_date, end_date)## 'getSymbols' currently uses auto.assign=TRUE by default, but will
## use auto.assign=FALSE in 0.5-0. You will still be able to use
## 'loadSymbols' to automatically load data. getOption("getSymbols.env")
## and getOption("getSymbols.auto.assign") will still be checked for
## alternate defaults.
##
## This message is shown once per session and may be disabled by setting
## options("getSymbols.warning4.0"=FALSE). See ?getSymbols for details.##
## WARNING: There have been significant changes to Yahoo Finance data.
## Please see the Warning section of '?getSymbols.yahoo' for details.
##
## This message is shown once per session and may be disabled by setting
## options("getSymbols.yahoo.warning"=FALSE).## Warning: ^GDAXI contains missing values. Some functions will not work if
## objects contain missing values in the middle of the series. Consider using
## na.omit(), na.approx(), na.fill(), etc to remove or replace them.data1 = subset(data1, select = c("Date", "Open", "Adj.Close"))
names(data1) = c("Date", "Open", "Close")
data1$Date = as.Date(data1$Date)
data2 = df_crawl_time_series(stock2, start_date, end_date)
data2 = subset(data2, select = c("Date", "Open", "Adj.Close"))
names(data2) = c("Date", "Open", "Close")
data2$Date = as.Date(data2$Date)
#Training and testing index
data1 = xts(data1[, -1], order.by = data1[, 1])
data2 = xts(data2[, -1], order.by = data2[, 1])
data = merge(data1, data2)
data = as.data.frame(data)
data = subset(data, !is.na(data$Close) & !is.na(data$Close.1))
data$ratio = data$Close/ data$Close.1
# plot(data$ratio)
bb_ratio = data.frame(BBands(data$ratio,n = n_days))
data = cbind(data, bb_ratio)
data_sub = tail(data, 1000)
plot(data_sub$ratio)
lines(data_sub$mavg, col = "red")
lines(data_sub$up, col = "blue")
lines(data_sub$dn, col = "green")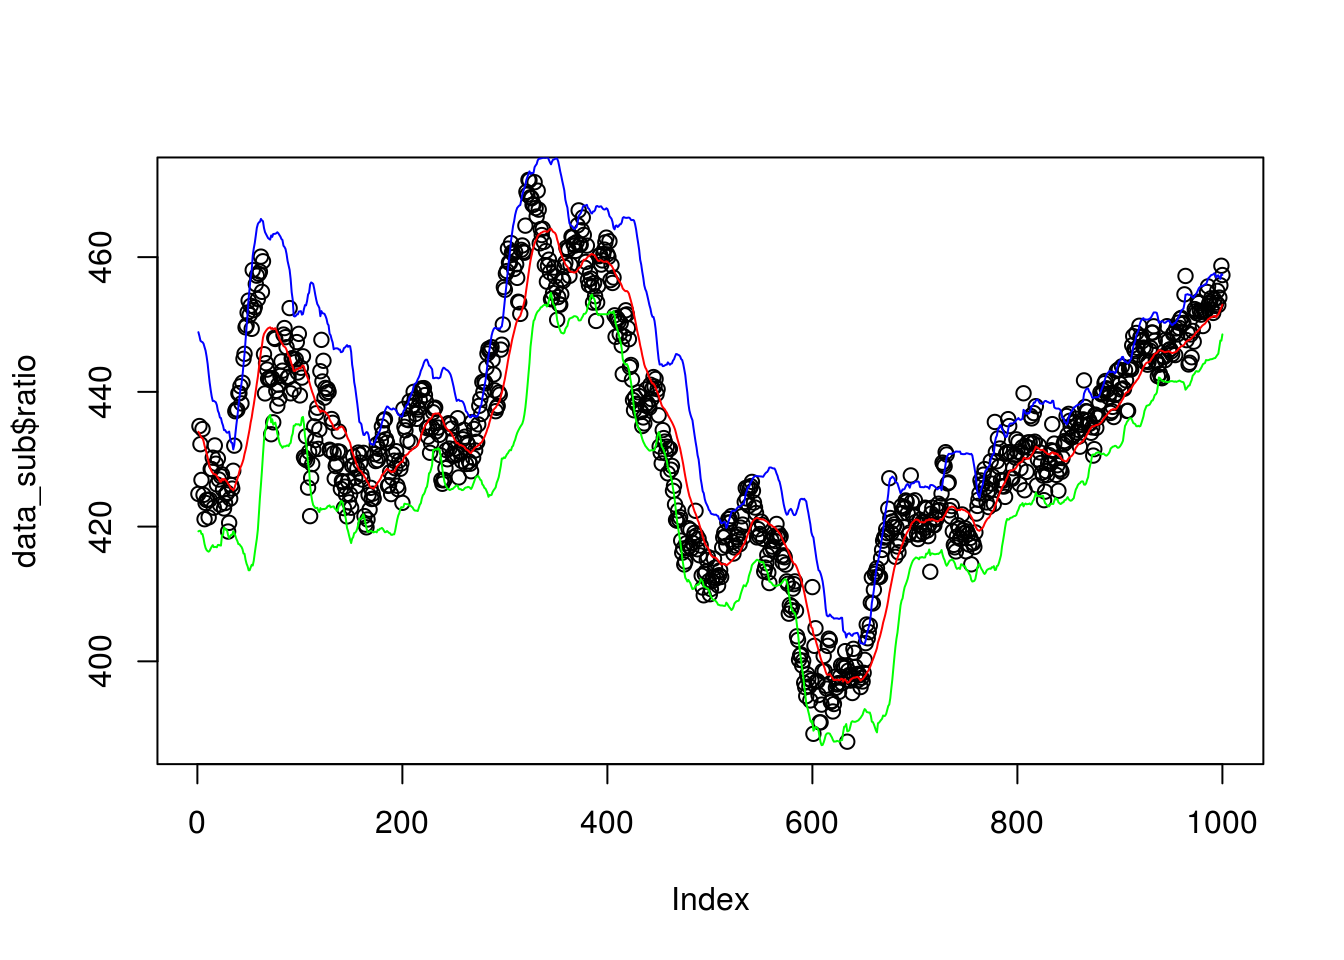
#If lower than
data_sub$longs <- data_sub$ratio <= data_sub$dn # buy spread when its value drops below 2 standard deviations.
data_sub$shorts <- data_sub$ratio >= data_sub$up # short spread when its value rises above 2 standard deviations.

#  exit any spread position when its value is at moving average
data_sub$longExits   <- data_sub$ratio >= data_sub$mavg
data_sub$shortExits <- data_sub$ratio <= data_sub$mavg


# #  define indices for training and test sets
# trainset <- 1:as.integer(nrow(data) * prop_train)
# testset <- (length(trainset)+1):nrow(data)

#Signal
data_sub$posL1 = NA
data_sub$posL2 = NA
data_sub$posS1 = NA
data_sub$posS2 = NA

# initialize to 0
data_sub$posL1[1] <- 0; data_sub$posL2[1] <- 0
data_sub$posS1[1] <- 0; data_sub$posS2[1] <- 0

data_sub$posL1[data_sub$longs] <- 1
data_sub$posL2[data_sub$longs] <- -1

data_sub$posS1[data_sub$shorts] <- -1
data_sub$posS2[data_sub$shorts] <- 1

data_sub$posL1[data_sub$longExits] <- 0
data_sub$posL2[data_sub$longExits] <- 0
data_sub$posS1[data_sub$shortExits] <- 0
data_sub$posS2[data_sub$shortExits] <- 0

#positions
data_sub$posL1 <- zoo::na.locf(data_sub$posL1); data_sub$posL2 <- zoo::na.locf(data_sub$posL2)
data_sub$posS1 <- zoo::na.locf(data_sub$posS1); data_sub$posS2 <- zoo::na.locf(data_sub$posS2)
data_sub$position1 <- data_sub$posL1 + data_sub$posS1
data_sub$position2 <- data_sub$posL2 + data_sub$posS2

#Returns
data_sub$dailyret1 <- ROC(data_sub$Close) #  last row is [385,] -0.0122636689 -0.0140365802
data_sub$dailyret2 <- ROC(data_sub$Close.1) #  last row is [385,] -0.0122636689 -0.0140365802

#Backshifting here. But signal is for following day returns!. So can still use latest Z-score
data_sub$date = as.Date(row.names(data_sub))
data_sub = xts(data_sub[,-which(names(data_sub) == "date")], order.by = data_sub[, which(names(data_sub) == "date")])

#Doesn't account for number of shares!!!!!
data_sub$pnl = lag(data_sub$position1, 1) * data_sub$dailyret1  + lag(data_sub$position2, 1) * data_sub$dailyret2

#Performance analytics
tryCatch({
  charts.PerformanceSummary(data_sub$pnl)
}, error = function(e){})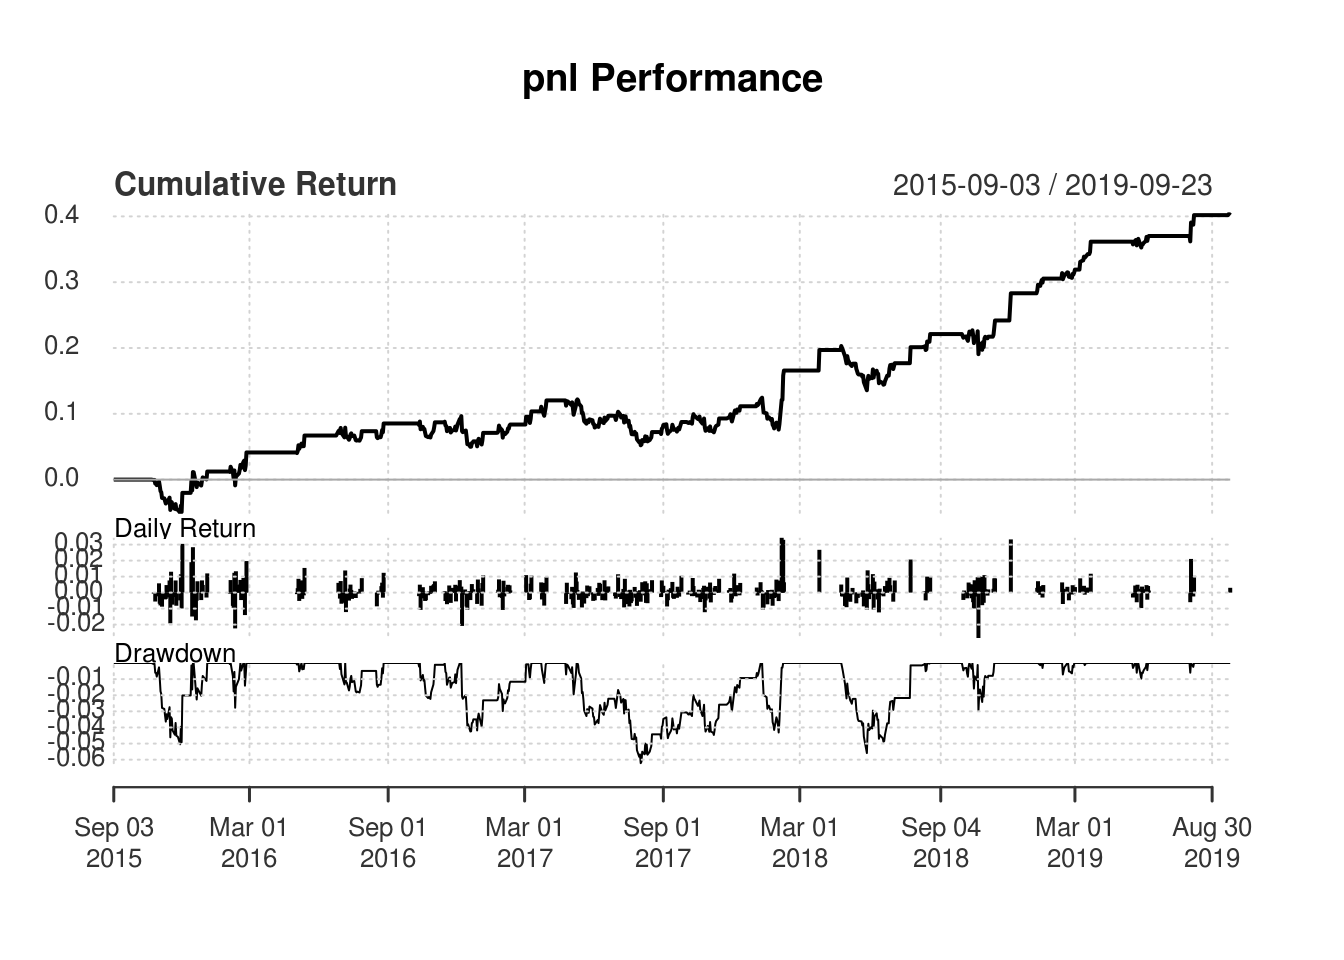
table.Drawdowns(data_sub$pnl)## From Trough To Depth Length To Trough Recovery
## 1 2017-05-11 2017-08-02 2018-01-09 -0.0622 164 57 107
## 2 2018-04-26 2018-05-29 2018-08-17 -0.0559 78 21 57
## 3 2015-10-26 2015-11-30 2015-12-17 -0.0504 38 25 13
## 4 2018-01-11 2018-02-01 2018-02-07 -0.0431 19 15 4
## 5 2016-12-08 2016-12-19 2017-03-10 -0.0425 63 8 55table.DownsideRisk(data_sub$pnl)## pnl
## Semi Deviation 0.0030
## Gain Deviation 0.0057
## Loss Deviation 0.0041
## Downside Deviation (MAR=210%) 0.0091
## Downside Deviation (Rf=0%) 0.0029
## Downside Deviation (0%) 0.0029
## Maximum Drawdown 0.0622
## Historical VaR (95%) -0.0069
## Historical ES (95%) -0.0104
## Modified VaR (95%) -0.0043
## Modified ES (95%) -0.0043table.AnnualizedReturns(data_sub$pnl)## pnl
## Annualized Return 0.0898
## Annualized Std Dev 0.0773
## Annualized Sharpe (Rf=0%) 1.1617#Extract the moving average, ratio
update = paste(stock1, stock2,
"Current ratio is:", round(as.numeric(data_sub$ratio[nrow(data_sub)]), 3),
"Moving average is", round(as.numeric(data_sub$mavg[nrow(data_sub)]), 3),
"Expected profits left in %", abs(round(100 * (as.numeric(data_sub$ratio[nrow(data_sub)]) - as.numeric(data_sub$mavg[nrow(data_sub)]))/as.numeric(data_sub$ratio[nrow(data_sub)]), 1)),
"UB is", round(as.numeric(data_sub$up[nrow(data_sub)]), 3),
"LB is", round(as.numeric(data_sub$dn[nrow(data_sub)]), 3)
)
if(as.numeric(data_sub$ratio[nrow(data_sub)]) < as.numeric(data_sub$dn[nrow(data_sub)])) {
update = paste(update, "Long ratio!")
} else{
update = paste(update, "\nDon't enter\n")
}
if(as.numeric(data_sub$ratio[nrow(data_sub)]) > as.numeric(data_sub$up[nrow(data_sub)])) {
update = paste(update, "Short ratio!")
} else{
update = paste(update, "Don't enter")
}
# if(as.numeric(data_sub$ratio[nrow(data_sub)]) < as.numeric(data_sub$mavg[nrow(data_sub)])) {
# update = paste(update, "Liquidate position!")
# } else{
# update = paste(update, "Hold")
# }
#pushover(message = update, user = Sys.getenv("pushover_user"), app = Sys.getenv("pushover_app"))