Volatility targeting could potentially increase risk-adjusted returns for quantitative strategies
Note: Man AHL’s framework in this paper is used in the write-up here.
Let’s say you researched and managed to find a quantitative strategy that suits your risk-reward preferences. How do you further improve your strategy while managing your risk?
A common way in the trend-following and risk parity space is to target risk - also known as volatility targeting.
In this article, I will present some simulations to bring you through my thought process on how I apply volatility targeting to my strategies.
My simulations in this article showed that by applying volatility targeting, I could potentially increase my risk-adjusted returns by 10% (risk adjusted metric sharpe ratio increase from 1.62 to 1.79).
What is volatility targeting?
Volatility targeted funds are usually pegged to annualized volatility/ standard deviation. To provide some context, I will provide some intuition on how annualized standard deviation is derived.
Assuming variance of daily portfolio returns are independent (ignore serial correlation of returns), you could sum up variance of returns across days as follows,
Variance of portfolio returns across a year (252 trading days) = Var(ret1): Variance of return on day 1 + …. + Var(ret252): Variance of return on day 252.
If the variance of daily returns are the same, you could multiply variance of daily returns by 252 to obtain annualized variance of portfolio returns, Annual Variance = 252 * Var(ret)
To normalize it to annual standard deviation, you’ve to take a square root of Annual Variance.
How do you interpret this metric? Let’s say a strategy has an expected returns of 8% with annual standard deviation of 10%. Based on naive normality assumptions, there’s a 68% chance that the fund’s annualized return will be between -2% to 18%; and 95% chance that the fund’s returns will be between -12% to 28%.
There are couple of ways for fund managers to derive the volatilities,
- One way is to simply find the standard deviation of returns over last X days and annualize it.
- A second way is to find the exponentially weighted standard deviation. See here (https://financetrain.com/calculate-historical-volatility-using-ewma/) for further explanation. In my simulations below, I’m using this variation.
Are we leaving chips on the table? Can we afford more risk? When should we take chips off the table?
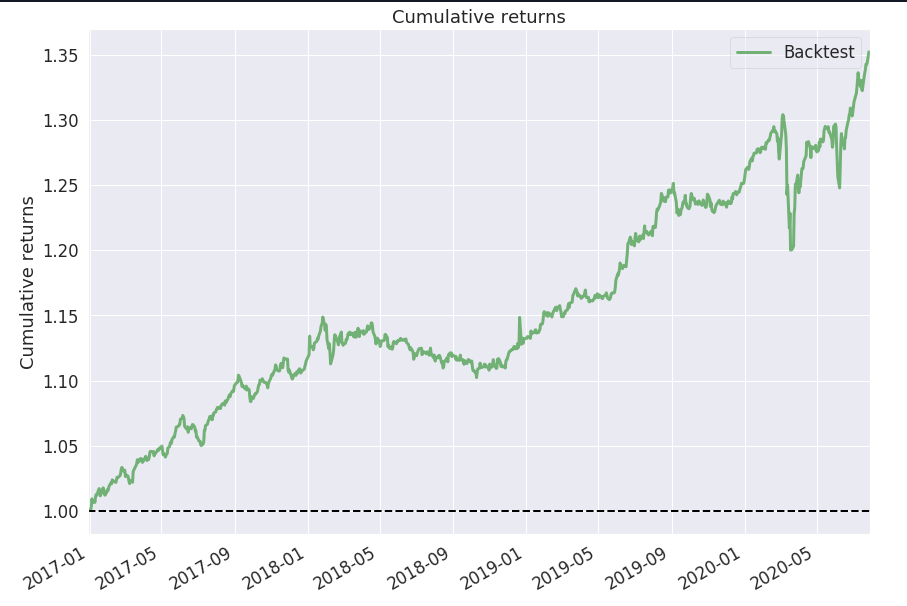
Below, I simulate a non volatility-targeted risk-parity portfolio rebalanced monthly i.e. portfolio is allocated across different asset classes based on risk rather than dollar value. Within asset classes, tickers are also risk-weighted. See here (https://en.wikipedia.org/wiki/Risk_parity) for further explanation.
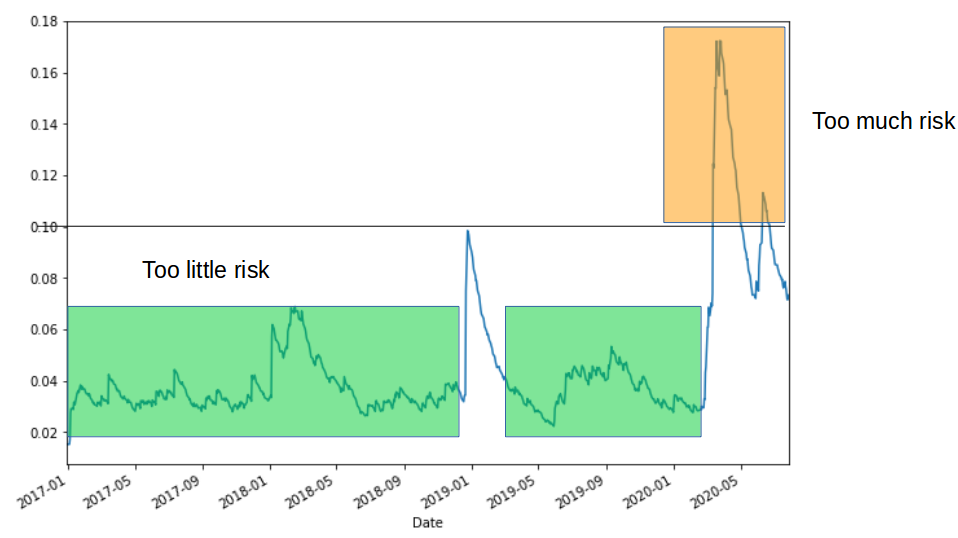
Rolling standard deviation of raw portfolio is plotted below to illustrate the portfolio risk across time. From the diagram below, you would notice that there are periods where the portfolio risk is significantly below the 10% volatility target. Are there chips left on the table? Could you afford more risk?
There are periods where portfolio risk is significantly above the 10% volatility target. Case in point during Covid sell-off? Should you be reducing risk instead?
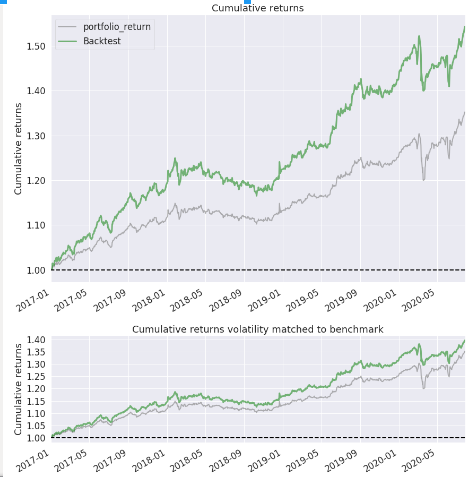
Equity curves and portfolio statistics are included below for benchmarking purposes.
| Portfolio | Annualized returns | Volatility | Sharpe | Max Drawdown | Return/Max Drawdown | Skewness |
|---|---|---|---|---|---|---|
| Benchmark | 8.97% | 5.5% | 1.62 | -7.96% | 1.12 | -1.14 |
What if we target risk? i.e. undertake more risk during calm periods and less risk during turbulent periods?
So does taking more risk during calm periods and reducing risk during turbulent periods pay off?
Before, we proceed further, here are some assumptions I included in the simulations,
- Portfolio is rebalanced monthly at the start of the trading day.
- On a daily basis, the algorithm checks for the current standard deviation of portfolio based on lookback period of 36 days. If it’s lesser than 10%, it will leverage proportionately (to a cap of 1.6 times). If it’s more than 10%, leverage will be reduced.
- Leverage financing costs and commission fees are included.
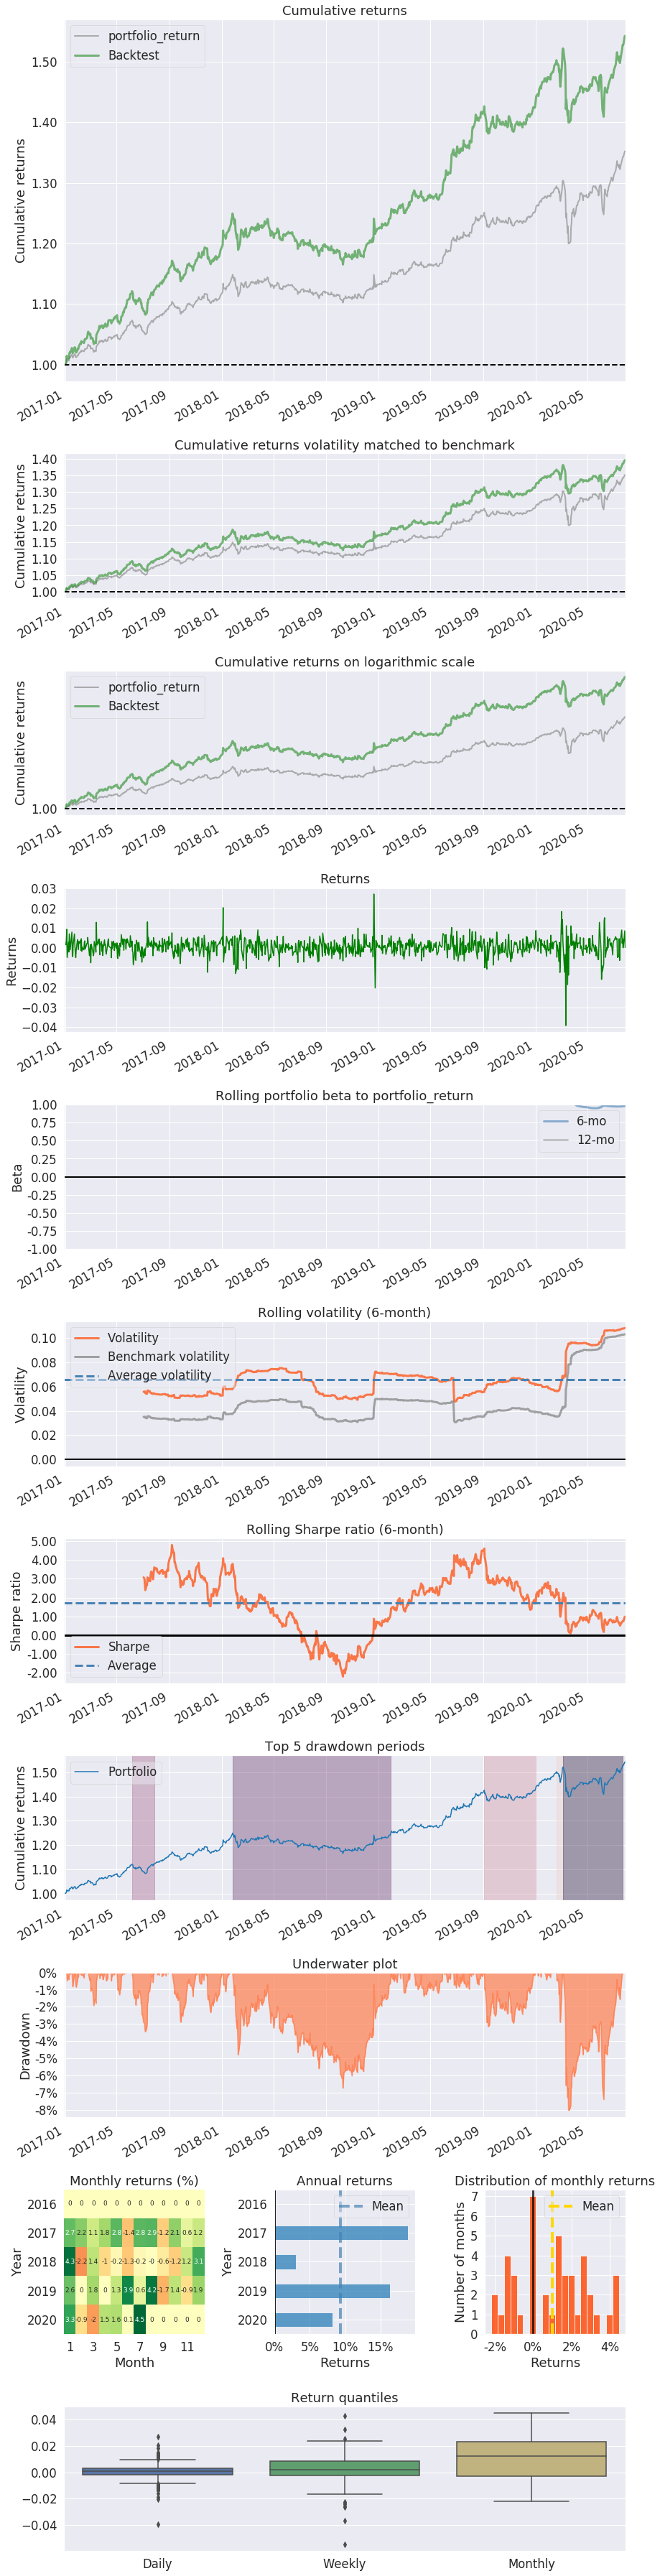
Based on the equity curve and portfolio statistics below, the answer to the question posed earlier in the section is a resounding YES! It’s risk-reducing and returns enhancing to target volatility. Risk adjusted returns (Sharpe ratio) increased by 10% (1.62 to 1.79) and Return/ Max Drawdown is considerably higher. You would also notice that the negative skewness of the strategy improved considerably from -1.14 to -0.8.
| Portfolio | Annualized returns | Volatility | Sharpe | Max Drawdown | Return/Max Drawdown | Skewness |
|---|---|---|---|---|---|---|
| Benchmark | 8.97% | 5.5% | 1.62 | -7.96% | 1.12 | -1.14 |
| Vol target (10%, max leverage of 1.6 times) | 13.92% | 7.4% | 1.79 | -8.02% | 1.73 | -0.8 |
Risk-reward preferences
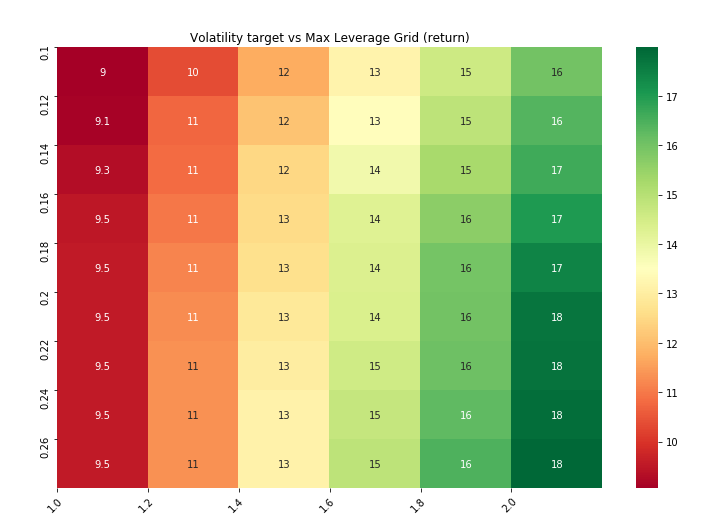
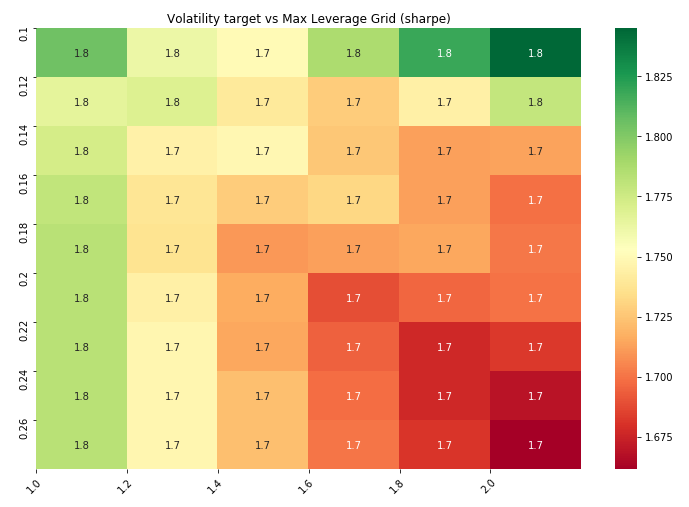
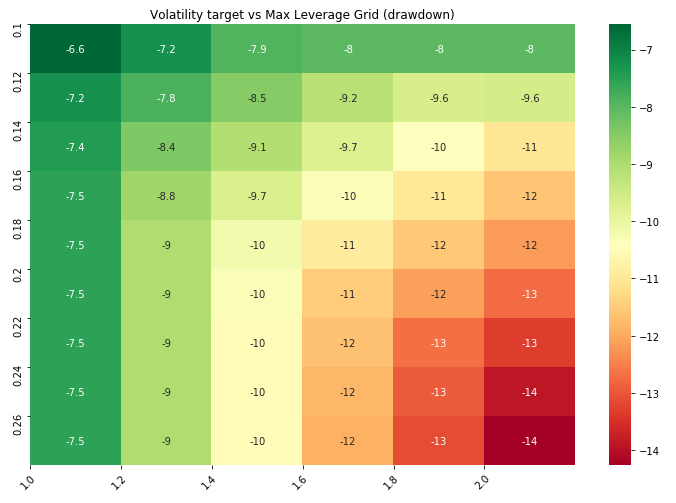
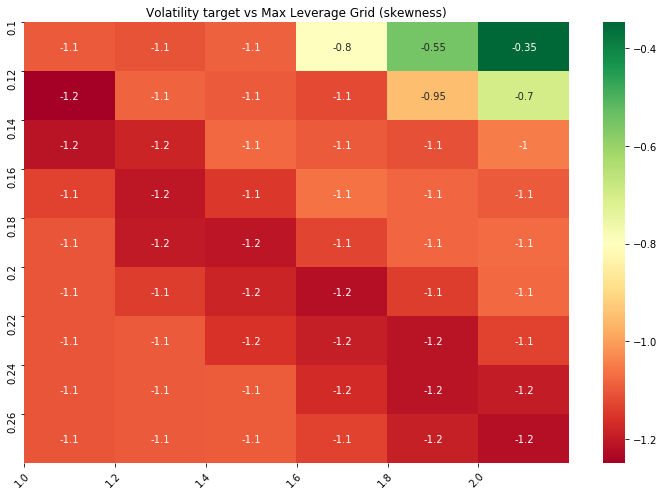
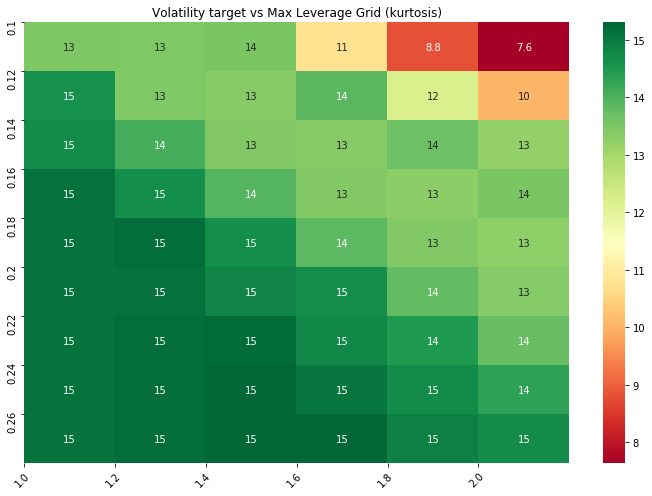
Above example is all but a single scenario. You could carry out a grid search to find the appropriate volatility target and leverage possibility space.
I’ve included the possibility space with respect to annualized returns, sharpe ratio, max drawdown to understand the risk-reward preferences.
Caveat
Note: Above portfolio is currently in incubation prior to deployment.
Full tear sheet of 10% volatility target and Max leverage of 1.6 included for reference